A Real Factory Story on OEE, Unplanned Downtime, and Lost Capacity
Introduction
What You Will Learn
- Causes of downtime in manufacturing
- What is the cause of machine downtime
- Unplanned downtime in manufacturing
- Unplanned downtime examples
- Average cost of downtime in manufacturing
- Cost of unplanned downtime in manufacturing
- Planned downtime in manufacturing
- Manufacturing downtime reasons – low and high hanging fruit
- How a machine monitoring system reduces unplanned downtime
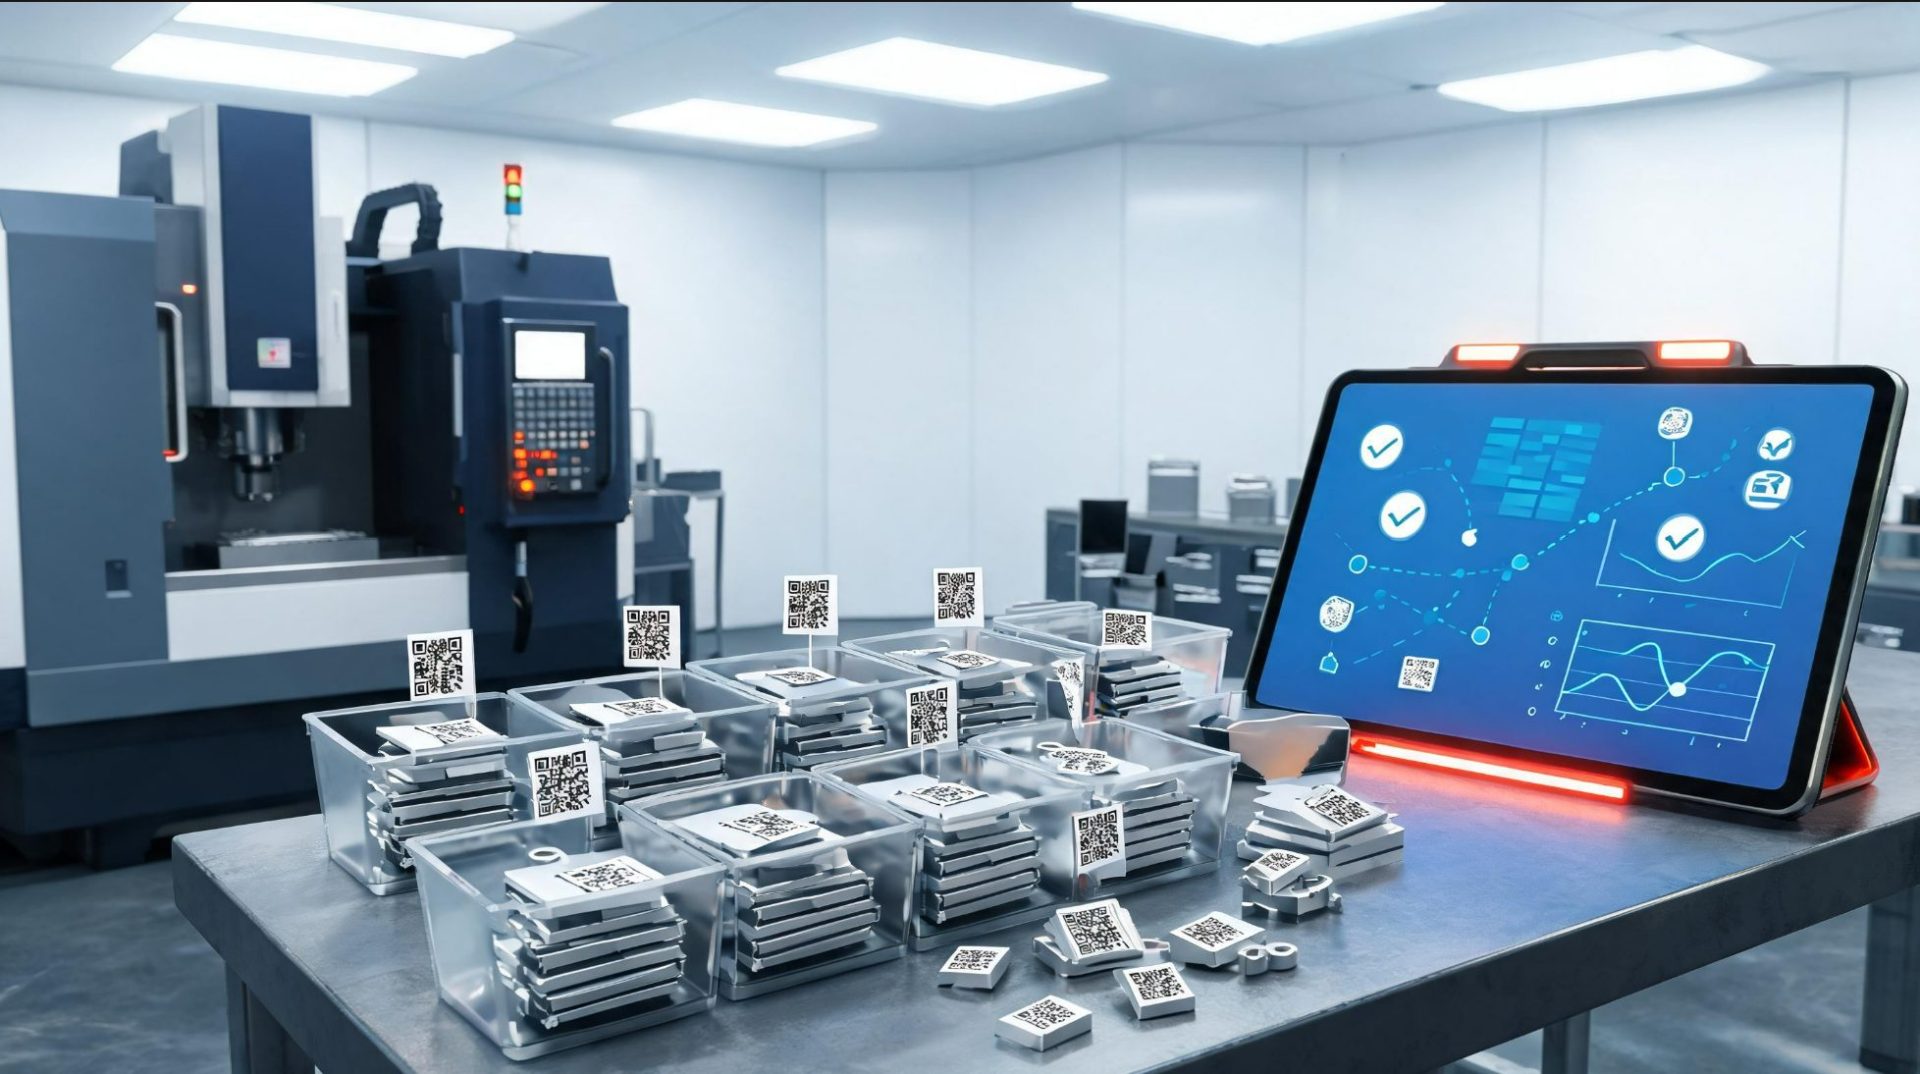
When We Walked Into the Plant
The plant had more than 20 CNC and VMC machines running discrete manufacturing operations with frequent changeovers.
The shop floor looked active. Machines were running. Operators were engaged.
The plant head told us:
“Our OEE is around 40%. That’s expected in HMLV manufacturing.”
On paper, that sounded reasonable. On the shop floor, the numbers told a different story.
Causes of Downtime in Manufacturing:
What We Observed First
Within the first few hours, several patterns became clear:
- Machines starting production 10–15 minutes late
- Operators stopping early before shift end
- Waiting for tool or process confirmation
- Searching for shared gauges and fixtures
None of these were recorded as downtime.
These repeated every shift, quietly adding up to hours of lost production time per day.

What Is the Cause of Machine Downtime?
Machine downtime is often assumed to be mechanical.
In reality, downtime arises from a combination of people, process, and system issues.
Process-Related Downtime
- Setup and changeover time
- First-part inspection delays
- Tool adjustment and replacement
These are necessary but reducible.
Machine Breakdowns
- Avoidable failures
- Weak preventive maintenance
- Delayed reporting and response
Without accurate data, these causes remain invisible.
Manufacturing Downtime Reasons – Low and High Hanging Fruit
Low Hanging Fruit Downtime (≈30%)
Low hanging fruit downtime is caused by work discipline and shop-floor practices, including:
- Late shift starts
- Extended tea and lunch breaks
- Early shift endings
- Delay in reporting machine issues
- Searching for tools and fixtures
In an 8-hour shift, these losses can easily consume 45–60 minutes, or 12% of available time.
They are easy to fix , once measured.
High Hanging Fruit Downtime (≈70%)
High hanging fruit downtime is caused by system and process inefficiencies, such as:
- High setup and changeover time
- Long inspection queues
- Machine breakdowns
- No raw material from upstream processes
- Power shutdowns
These directly reduce machine availability and require structured, data-driven action.
Unplanned Downtime in Manufacturing
Unplanned downtime is expensive because it is unpredictable.
In multi-process manufacturing:
- Each process feeds the next
- Downtime in one machine starves downstream operations
To compensate, manufacturers build finished goods inventory.
Inventory is directly proportional to unpredictability , and unpredictability is driven by unplanned downtime.
Unplanned Downtime Examples from the Shop Floor
Common unplanned downtime examples include:
- Machine breakdowns
- Tool breakage
- No raw material availability
- Power failures
- Abnormally long setup changes
- Operators starting late or stopping early
Most of these are underestimated or missed in manual records.
Average Cost of Downtime in Manufacturing
The average cost of downtime in manufacturing can be calculated using the machine hour rate.
Cost of downtime = Machine hour rate × Downtime duration
Example:
- Machine hour rate: ₹500
- Downtime: 6 hours/day
Daily downtime cost = ₹3,000 per machine
Scaled across machines and months, downtime becomes a major profitability drain.
Cost of Unplanned Downtime in Manufacturing
Unplanned downtime reduces predictability.
Lower predictability leads to:
- Higher finished goods inventory
- Increased working capital
- Higher interest costs
Finished goods inventory is particularly expensive because it includes raw material, processing cost, and margin, all locked in stock.
Planned Downtime in Manufacturing
Planned downtime is scheduled and controlled.
Examples include:
- Autonomous maintenance at shift start
- Preventive maintenance on weekly offs
- Maintenance during non-working shifts
- Annual shutdowns
The objective is always to replace unplanned downtime with planned downtime.
How a Machine Monitoring System Reduces Unplanned Downtime
When sfHawk was connected to the machines, downtime data became objective and real-time.
sfHawk enabled:
- Accurate downtime tracking
- Planned vs unplanned downtime classification
- Automated OEE calculation
- Root-cause analysis
- Real-time alerts for breakdowns and deviations
This allowed teams to address low hanging fruit immediately and high hanging fruit systematically.
30-Day Improvement Snapshot
|
Metric |
Before sfHawk |
After 30 Days |
|
Availability |
62% |
78% |
|
Performance |
92% |
96% |
|
Quality |
95% |
96% |
|
OEE |
40% |
57% |
This improvement came without additional CapEx, only better visibility and better decisions.
Why Manual Downtime Tracking Fails
Manual downtime tracking systems:
- Miss micro-stoppages
- Underreport unplanned downtime
- Depend on human judgment
- Delay corrective action
Automated machine monitoring provides accurate, real-time manufacturing data, which is essential for continuous improvement and sustained OEE improvement.
Final Thoughts
Downtime in manufacturing is often treated as an unavoidable reality , something to be managed around rather than eliminated. In practice, however, downtime itself is not inevitable. What is inevitable is the loss of capacity that goes unmeasured.
When machines stop for a few minutes at a time, when shifts start late, when setups stretch longer than planned, or when breakdowns are responded to slowly, the lost time quietly disappears from records. Over weeks and months, these small, unmeasured losses accumulate into a significant portion of available capacity, typically 20–25% in most factories.
This capacity already exists. It is paid for through capital expenditure, manpower, energy, and overheads. Yet it remains locked inside blind spots created by manual tracking, assumptions, and accepted shop-floor habits.
Once downtime is measured accurately and in real time, it stops being “normal.” Patterns become visible, causes become clear, and improvement becomes deliberate rather than reactive. Decisions shift from firefighting to prevention, and gains become repeatable.
In manufacturing, visibility is the foundation of control. When downtime becomes visible, improvement becomes systematic, sustainable, and predictable.
Learn More About Manufacturing Downtime and OEE
🌐 www.sfhawk.com 📧 inquiry@sfhawk.com 📞 91120 98351