Your machine is technically running.
Production targets look close to achievable.
There are no major breakdowns.
And yet, OEE refuses to improve.
If you look closely at high speed manufacturing lines, especially in automotive, packaging, and electronics assembly, the real damage often comes from something far less dramatic than a breakdown.
Micro stoppages.
These short, frequent interruptions lasting a few seconds to a few minutes silently destroy performance. They rarely trigger maintenance alerts. They often go unrecorded. And they almost never get the attention they deserve.
So the real question plant managers are beginning to ask is:
Why are micro stoppages killing your OEE and how can real time signal monitoring fix it?
Let us investigate.
The Hidden Cost of Micro Stoppages in High Speed Production
In high speed lines, even a 10 second stop repeated 50 times per shift can translate into significant output loss. Yet most traditional systems:- Do not capture stoppages below a certain duration
- Rely on manual downtime entry
- Fail to correlate machine signals with production loss
- Aggregate data in a way that hides short interruptions
- Sensor misalignment
- Minor material jams
- Pneumatic pressure fluctuations
- Intermittent PLC signals
- Small feeder interruptions
- Operator adjustments
Why Traditional Preventive Maintenance Fails Against Micro Stoppages
Preventive maintenance works well for predictable wear components. But micro stoppages are rarely caused by a single failing part. They are often the result of:- Intermittent signal instability
- Process variation
- Small mechanical inconsistencies
- Operator interactions
- Environmental fluctuations
- Sub second speed drops
- Repeated start stop cycles
- Small torque variations
- Brief overload spikes
How Real Time Signal Monitoring Captures Micro Stoppages
To truly reduce micro stoppages in manufacturing, the system must capture raw machine level signals such as:- Cycle start and cycle complete signals
- Motor load values
- Conveyor movement signals
- Proximity sensor triggers
- Fault bit transitions
- Line speed variations
High Frequency Data Sampling
Micro stoppages often occur within seconds. If your system logs data every minute, you will never see them. Real time signal monitoring requires:- High frequency data capture
- Millisecond level timestamping
- Continuous edge buffering
Accurate State Transition Detection
Advanced monitoring systems track:- Running to idle transitions
- Idle to running transitions
- Repeated short stop patterns
- Deviation from ideal cycle time
Integrating OEE with Real Time Machine Signals
Most OEE monitoring systems calculate: Availability × Performance × Quality However, performance losses caused by micro stoppages are often misclassified as slow running or unexplained losses. By integrating OEE with real time machine signals, manufacturers can:- Detect micro stops below 60 seconds
- Quantify cumulative lost time
- Identify machines with the highest micro stop frequency
- Compare shifts and operators objectively
From Hidden Loss to Measurable KPI
Once micro stoppages are quantified:- They become measurable
- They become accountable
- They become improvable
Edge Computing in Industrial Monitoring for Micro Stoppage Detection
Cloud based systems alone are often insufficient for high speed signal analysis. Latency matters. When dealing with short cycle time machines, sending every signal to the cloud can cause:- Delayed detection
- Data overload
- Network congestion
How Edge Analytics Helps
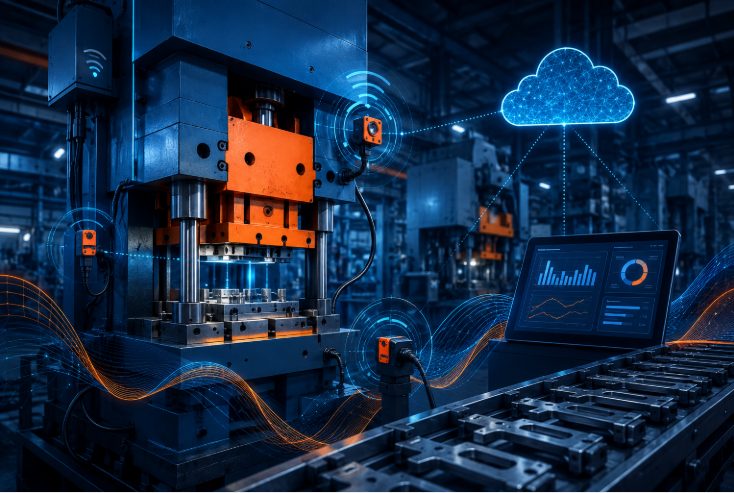
An edge device placed near the machine can:- Process high frequency signals locally
- Detect micro stoppage patterns instantly
- Buffer and compress relevant data
- Send summarized events to the central server
Real World Scenario: Packaging Line with Repeated 8 Second Stops
Consider a high speed packaging line running at 120 units per minute. The plant reports:- No major breakdowns
- 92 percent availability
- 78 percent performance
- 70 micro stoppages per shift
- Average duration of 8 seconds
- Cumulative lost time of 9 minutes per shift
- Primary cause: inconsistent material feed sensor
- Significant output loss
- Increased overtime
- Hidden production cost
How sfHawk Uses Real Time Data to Detect Micro Stoppages Before They Escalate
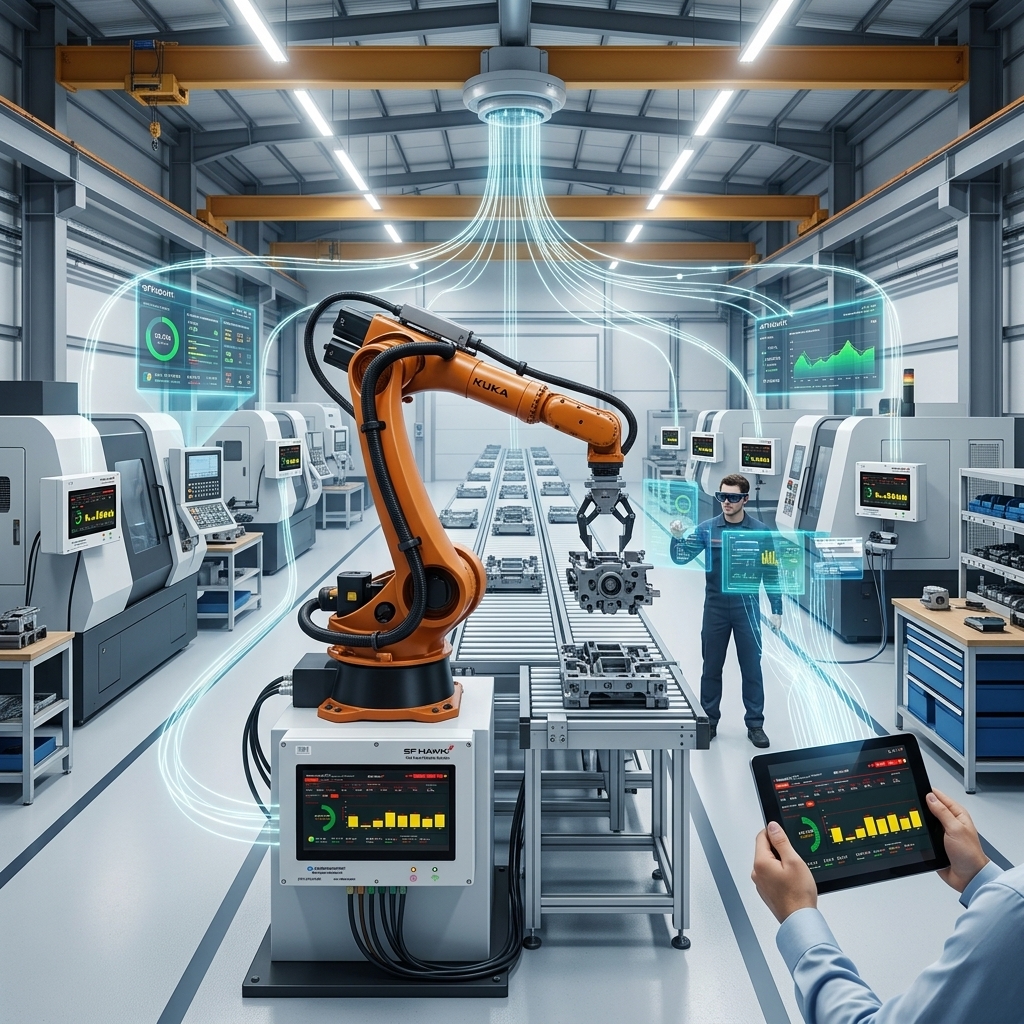
sfHawk is designed to address precisely this problem.Deep Signal Level Monitoring
sfHawk connects directly to machine controllers and captures:- Cycle signals
- Status bits
- Production counters
- Downtime transitions
- Frequent state changes
- Short duration idle events
- Deviation from standard cycle time
Real Time OEE Optimization
Instead of static reporting, sfHawk:- Quantifies micro stop losses in performance
- Displays machine wise micro stoppage frequency
- Highlights shifts with abnormal patterns
- Correlates stoppages with operators and material batches
Edge Enabled Architecture
With edge computing capabilities, sfHawk:- Processes high frequency signals locally
- Minimizes latency
- Ensures uninterrupted monitoring
- Reduces network load
Actionable Dashboards for Plant Heads
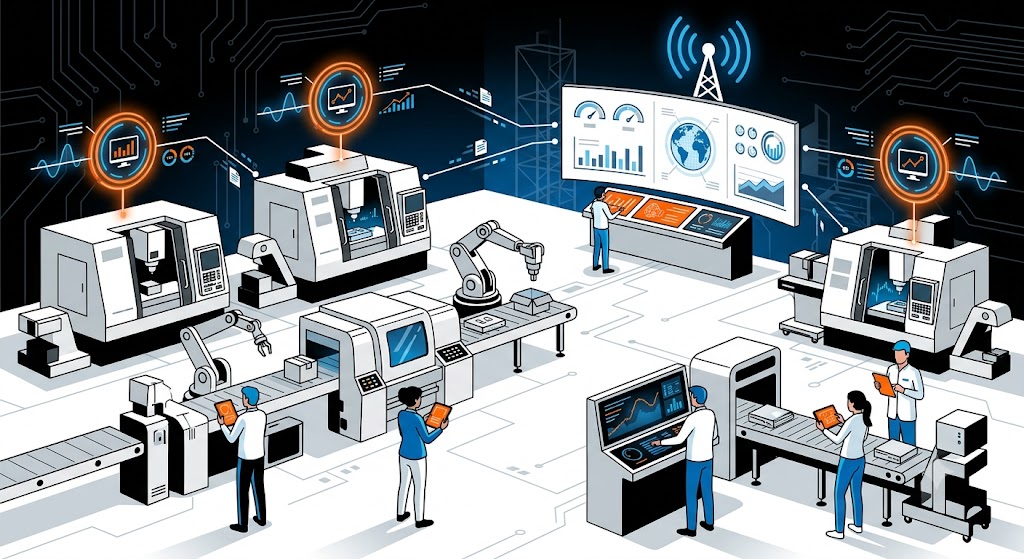
Plant heads and operations managers get:- Centralized OEE dashboards
- Micro stoppage heat maps
- Trend analysis over days and weeks
- Comparative performance across lines
Rethinking Monitoring Strategy: Are You Measuring the Right Losses?
Many factories believe they are monitoring effectively because they have:- Downtime reports
- Shift wise production summaries
- OEE dashboards
- Are you capturing stops below 30 seconds?
- Are you correlating signal level data with performance loss?
- Are you using edge analytics to detect short interruptions?
- Are micro stoppages visible as a separate KPI?