10 Manufacturing KPIs Every Plant Manager Should Track
TL;DR: Plant managers do not lack data — they lack the ten or so manufacturing performance indicators that actually predict output, quality, and cost. This guide covers OEE, machine utilization, downtime, throughput, production output, cycle time, rejection rate, first pass yield, MTTR/MTBF, and on-time delivery, plus why a manufacturing dashboard is what makes them usable day to day rather than buried in a spreadsheet.
Most plants already collect more manufacturing metrics than anyone can act on. The problem is rarely a shortage of data; it is a shortage of the right manufacturing KPIs, tracked consistently, and visible to the people who can actually do something about them. The ten production KPIs below cover equipment, throughput, quality, and maintenance, the four areas that determine whether a plant hits its numbers or explains why it didn’t.
Why Plant Managers Need a Manufacturing Dashboard, Not Just Reports
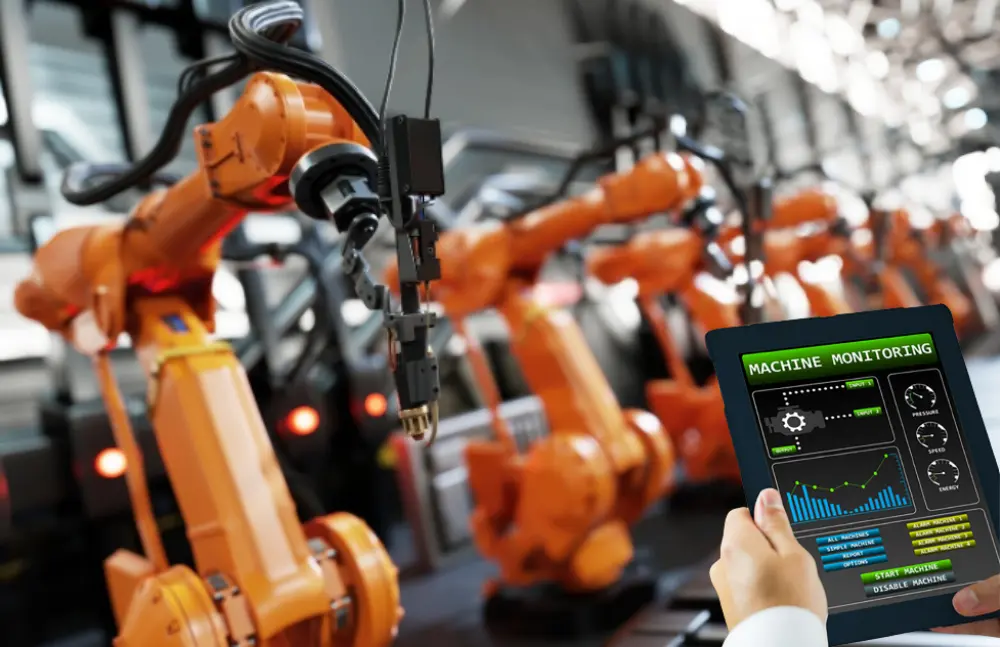
A monthly report tells you what happened last month. A manufacturing dashboard tells you what is happening on the floor right now, while there is still time to act on it. The difference matters because most of the KPIs below lose their value with age: an OEE number from three weeks ago cannot tell a supervisor which machine to check this shift. Manufacturing analytics platforms exist specifically to close that gap, pulling the same data plant managers used to wait for into a live view.
The 10 KPIs at a Glance
| KPI | What It Measures | Why Plant Managers Track It |
|---|---|---|
| OEE | Availability × Performance × Quality | Single score for overall equipment health |
| Machine Utilization | % of available time a machine actually runs | Exposes idle capacity before buying new equipment |
| Unplanned Downtime | Hours lost to unexpected stoppages | Largest single controllable loss category |
| Throughput | Units produced per hour/shift | Tracks whether output keeps pace with demand |
| Production Output | Total units completed in a period | Baseline for capacity and delivery planning |
| Cycle Time | Time to complete one production cycle | Flags performance loss and process drift |
| Rejection / Scrap Rate | % of units failing quality checks | Direct cost of poor quality |
| First Pass Yield | % of units passing quality without rework | Truer quality signal than scrap rate alone |
| MTTR / MTBF | Mean time to repair / between failures | Core maintenance metrics behind reliability |
| On-Time Delivery | % of orders shipped by promised date | Connects shop floor performance to customer trust |
1. Overall Equipment Effectiveness (OEE)
OEE is the closest thing manufacturing has to a universal scorecard, combining availability, performance, and quality into a single percentage. It is the OEE KPI most plant managers report upward because it compresses three separate loss categories into one number leadership can track over time. According to OEE.com, most manufacturers run closer to 60% OEE, while world-class performance sits around 85%, which is usually the single biggest gap a plant manager can point to when asked where the next round of improvement should go. sfHawk’s OEE monitoring solution calculates this automatically from live machine data rather than a manual shift-end tally.
2. Machine Utilization
Machine utilization measures the share of available time a machine is actually producing, separate from whether it is producing well. A machine can show decent OEE while it is running and still have poor utilization if it sits idle between jobs waiting on parts, tooling, or an operator. Tracking utilization alongside OEE is what tells a plant manager whether the next unit of output should come from a process fix or a scheduling fix.
3. Unplanned Downtime
Unplanned downtime is the hours a machine should have been running but wasn’t, for a reason nobody planned around. It is usually the largest recoverable loss category on the OEE breakdown, and it is only actionable once it is categorized by root cause rather than logged as a single lump total. A real-time monitoring case study shows what this looks like once downtime is broken out machine by machine instead of estimated at shift end.
4. Throughput
Throughput is units produced per hour or per shift, and it is the KPI that connects everything else to whether the plant can actually meet demand. Throughput can look healthy in aggregate while hiding a single bottleneck station that is quietly setting the pace for the entire line — which is why throughput should always be read alongside station-level or machine-level detail, not just the line total.
5. Production Output
Production output is the simplest of the ten KPIs: total units completed in a given period. It matters less on its own than in combination with the others, since output can rise while quality falls or downtime creeps up unnoticed. Most plant managers use production output as the top-line number and the remaining KPIs as the explanation for why it moved.
6. Cycle Time
Cycle time is how long one production cycle actually takes, measured against the ideal or rated cycle time for that part or process. A creeping gap between actual and ideal cycle time is often the earliest signal of a performance loss, showing up well before it is large enough to trigger a fault code or a quality reject.
7. Rejection / Scrap Rate
Rejection rate is the percentage of units that fail quality inspection outright, and it is one of the most direct cost figures on this list because scrapped material and rework hours both come straight off the bottom line. Tracking rejection rate by cause, not just by total percentage, is what turns this into a manufacturing quality metric a team can actually act on rather than a number that just goes up or down.
8. First Pass Yield
First pass yield measures the percentage of units that pass quality inspection the first time, without rework. It is a stricter and often more useful quality signal than scrap rate alone, because a part that required rework to pass still consumed labor and machine time even though it was never technically scrapped.
9. Maintenance Metrics: MTTR and MTBF
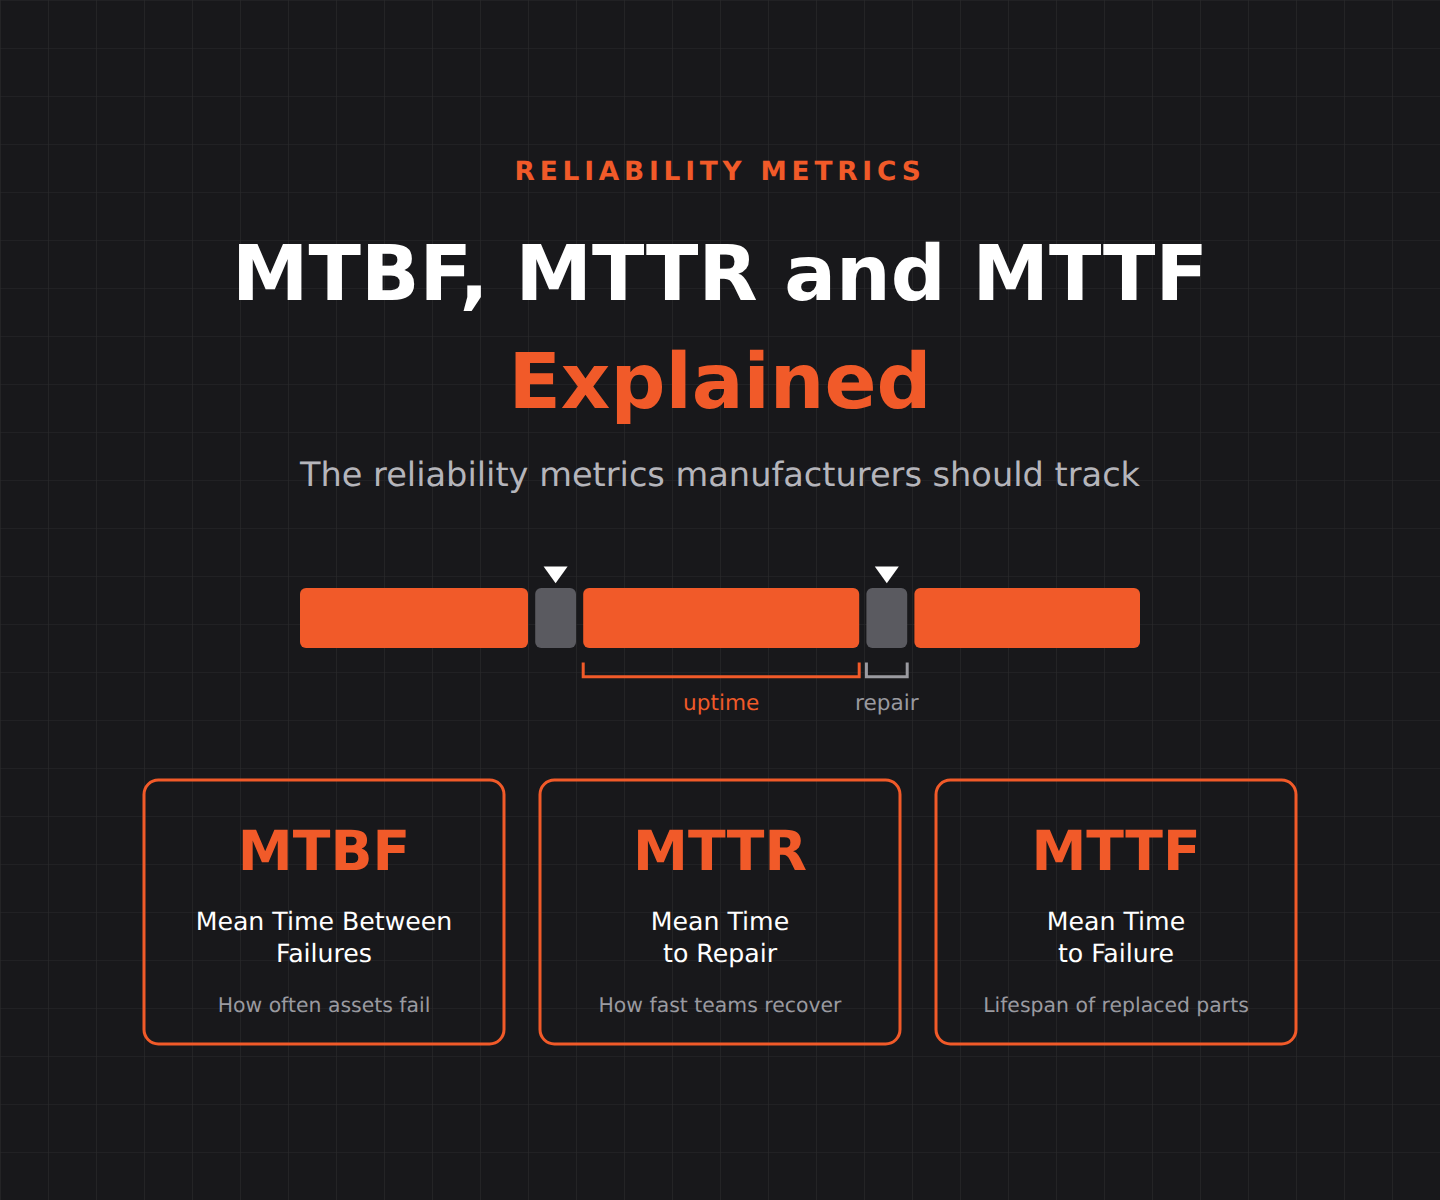
Mean Time To Repair (MTTR) and Mean Time Between Failures (MTBF) are the two maintenance metrics that separate a well-maintained plant from one that is constantly reacting to breakdowns. A short MTTR means the team fixes problems fast; a long MTBF means problems don’t happen as often to begin with. Read together, they tell a plant manager whether to invest in faster repair response or in preventive maintenance that avoids the failure altogether.
10. On-Time Delivery
On-time delivery is the percentage of orders shipped by their promised date, and it is the KPI that ties every metric above to something customers actually notice. A plant can hit strong internal numbers on OEE and throughput and still miss delivery dates if scheduling and capacity planning aren’t accounting for real machine availability — which is usually the last place teams look when delivery performance slips.
Manufacturing Benchmarking: Using These KPIs Across Sites
Manufacturing benchmarking only works if every site defines each KPI the same way. Two plants reporting “85% OEE” are not comparable if one counts planned maintenance as downtime and the other doesn’t. The ISO 22400 standard exists specifically to standardize these definitions, so multi-site manufacturers can compare performance without every comparison needing a footnote explaining whose formula was used.
Turning Manufacturing Performance Indicators into Action
Ten manufacturing performance indicators are only useful if someone sees them in time to act. Manual reporting means most of these numbers arrive a day, a week, or a month after the loss already happened. A connected manufacturing dashboard puts OEE, downtime, and throughput in front of the people running the shift while there is still a shift left to fix, which is the difference between a KPI that drives operational excellence and one that just gets reported in a monthly meeting. Use sfHawk’s RoI calculator to estimate what closing the gap on even one or two of these KPIs is worth on your own floor.
Frequently Asked Questions
What are the most important manufacturing KPIs for a plant manager?
OEE, unplanned downtime, and throughput are usually the three manufacturing KPIs plant managers check first, since together they cover equipment health, lost time, and whether output is keeping pace with demand. Quality metrics like rejection rate and first pass yield, plus maintenance metrics like MTTR and MTBF, round out a complete picture without adding so many numbers that nothing gets prioritized.
What is the difference between OEE and machine utilization?
OEE measures how well a machine performs while it is running, combining availability, performance, and quality into one score. Machine utilization measures how much of the available time the machine actually runs at all. A machine can have strong OEE and still have low utilization if it sits idle between jobs, so the two metrics answer different questions.
How often should manufacturing KPIs be reviewed?
OEE, downtime, and throughput are most useful reviewed in real time or at shift end, since that is when a supervisor can still act on what the numbers show. Quality and maintenance metrics are often reviewed daily or weekly, while on-time delivery and benchmarking comparisons are typically monthly. The right cadence depends on how quickly the KPI can actually be acted on.
Do I need special software to track these manufacturing KPIs?
Not strictly, spreadsheets and manual logs can track all ten KPIs. In practice, most plants find manual tracking breaks down once downtime and cycle time need to be captured at the machine level, which is why manufacturing dashboards that pull data directly from machine controllers have become the standard approach for real-time KPI tracking.
What is ISO 22400 and why does it matter for manufacturing KPIs?
ISO 22400 is the international standard that defines manufacturing KPIs like OEE, availability, and throughput using precise, consistent formulas. It matters because it lets manufacturers compare performance across different plants, lines, or software platforms without each comparison needing a separate explanation of how the number was calculated.
Track What Actually Moves the Plant
Ten manufacturing KPIs are more than enough to run a plant well, but only if they are tracked consistently, defined the same way across every shift and site, and visible while there is still time to act on them. That last part, visibility in time to act, is usually the difference between a metrics program that drives real improvement and one that just produces a monthly report nobody reads until it’s too late to change.
Get Started Today! Book a call with sfHawk | Email: inquiry@sfhawk.com | Phone: +91 91120 98351 | Website: www.sfhawk.com