How Mean Time Between Failures, Mean Time to Repair, and Mean Time to Failure differ, when to use each, and why the averages can hide your worst assets.
TL;DR: MTBF (Mean Time Between Failures), MTTR (Mean Time to Repair), and MTTF (Mean Time to Failure) are the three core reliability metrics manufacturers use to measure equipment uptime. MTBF and MTTR apply to repairable assets and track how often they fail and how fast they’re fixed. MTTF applies to non-repairable parts and measures average lifespan before replacement is required.
Key Takeaways
- MTBF and MTTR are a pair: MTBF measures failure frequency on repairable assets, MTTR measures how fast the team recovers from each failure.
- MTTF is the non-repairable counterpart: It is used for parts that get replaced, not fixed, when they fail.
- Averages can mislead: A healthy MTBF can still hide a chronic-failure asset if the average blends one long-running machine with one that fails weekly.
- Automate the calculation: Machine event history and downtime classification let these metrics calculate automatically instead of being reconstructed from paper logs after the fact.
MTBF vs MTTR vs MTTF: Comparison Table
| Metric | Measures | Applies To | Formula |
|---|---|---|---|
| MTBF | Average time a machine runs between failures | Repairable assets | Total Uptime ÷ Number of Failures |
| MTTR | Average time to restore a machine after failure | Repairable assets | Total Repair Time ÷ Number of Repairs |
| MTTF | Average time a part or asset runs before it fails and is replaced | Non-repairable assets | Total Operating Time ÷ Number of Units |
Worked Example: Same Machine, Three Metrics
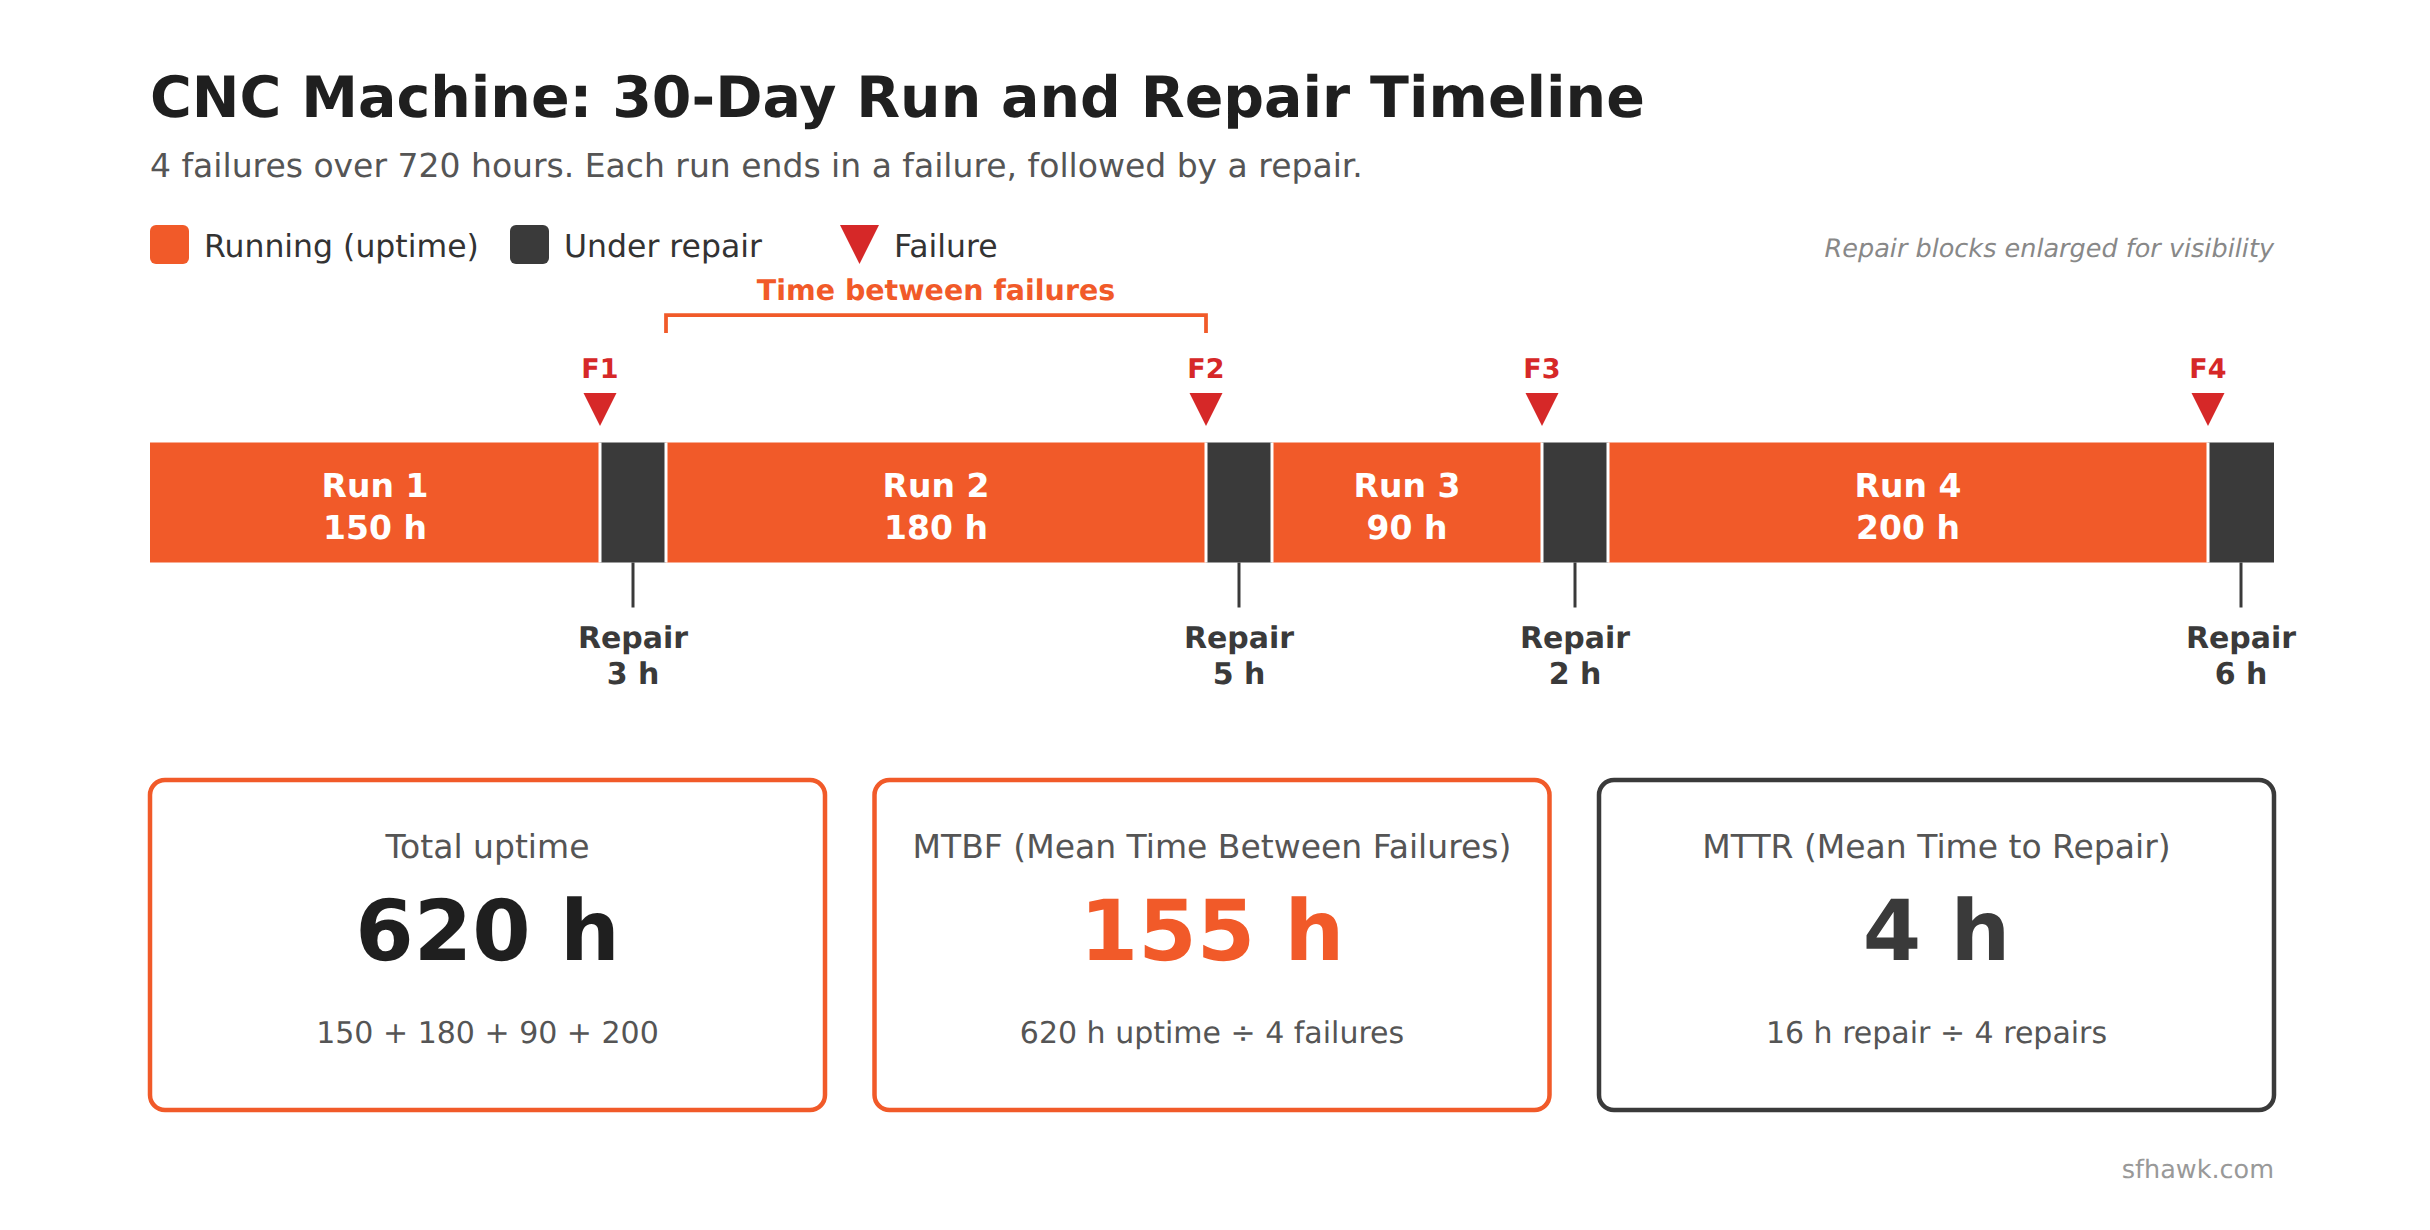
Take one CNC machine over a 30-day period (720 hours). It failed 4 times, with the following runtime and repair data:
| Failure # | Hours Run Before Failure | Repair Time (hrs) |
|---|---|---|
| 1 | 150 | 3 |
| 2 | 180 | 5 |
| 3 | 90 | 2 |
| 4 | 200 | 6 |
Total uptime = 620 hours across 4 run intervals. Total repair time = 16 hours across 4 repairs. That gives:
- MTBF = 620 ÷ 4 = 155 hours between failures
- MTTR = 16 ÷ 4 = 4 hours average repair time
If this were a non-repairable component instead, say a batch of 4 sensors that ran until failure and were discarded, the same 620 total operating hours would instead be reported as MTTF = 155 hours, with no repair time involved since the part is replaced, not restored.
Why the Average Can Hide Chronic Failures
MTBF is an average, and averages flatten variation. A fleet of five identical machines with an MTBF of 400 hours could mean every machine performs consistently, or it could mean four machines run for nearly 500 hours between failures while one fails every 80 hours and drags the average down without ever standing out in a summary report.
“A plant-wide MTBF number is almost useless on its own. The value is in breaking it down by asset, because the fleet average will always hide the one machine that’s actually costing you the most.”
Reliability Engineering Manager, industrial equipment manufacturer
This is where automatically calculated, asset-level metrics matter more than a manually tracked plant average. When machine event history and downtime reason codes are captured continuously, MTBF, MTTR, and failure trends can be calculated per asset, per failure mode, and per shift. That surfaces the chronic offender that a blended average would otherwise bury, and prioritizes it for root-cause work instead of routine maintenance.
When Each Metric Matters
- Use MTBF to compare reliability across machines or to track whether reliability is improving over time.
- Use MTTR to evaluate maintenance team responsiveness, spare-parts availability, and repair process efficiency.
- Use MTTF for components that are replaced rather than repaired: bearings, filters, sensors, consumable tooling.
- Use MTBF and MTTR together to separate a failure-frequency problem from a repair-speed problem. They call for very different fixes.
Frequently Asked Questions
Is higher MTBF better?
Yes. A higher MTBF means a machine runs longer, on average, between failures, which generally indicates better reliability. It should still be reviewed per asset rather than as a single plant-wide figure, since a fleet average can mask individual chronic failures.
What is a good MTTR?
There’s no universal target. It depends on the asset’s criticality, spare-parts strategy, and repair complexity. A commonly cited industrial benchmark is under 4 hours for critical production equipment, but the more useful comparison is your own MTTR trend over time and against similar assets in your plant.
Can MTBF be used for repairable assets?
Yes. MTBF is specifically designed for repairable assets, which is what distinguishes it from MTTF. If an asset is repaired and returned to service after failure, MTBF is the correct metric. If it’s replaced outright, MTTF applies instead.
Related Reading
MTBF, MTTR, and MTTF are strongest when paired with the downtime and quality data that feeds them. See how OEE ties reliability into overall equipment performance, and how automated downtime classification removes the manual work of reason-coding every stoppage.
Get Started Today! Book a call with sfHawk | Email: inquiry@sfhawk.com | Phone: +91 91120 98351 | Website: www.sfhawk.com