How an X-bar and R chart works, how to calculate the center line and control limits, and how to read an out-of-control signal.
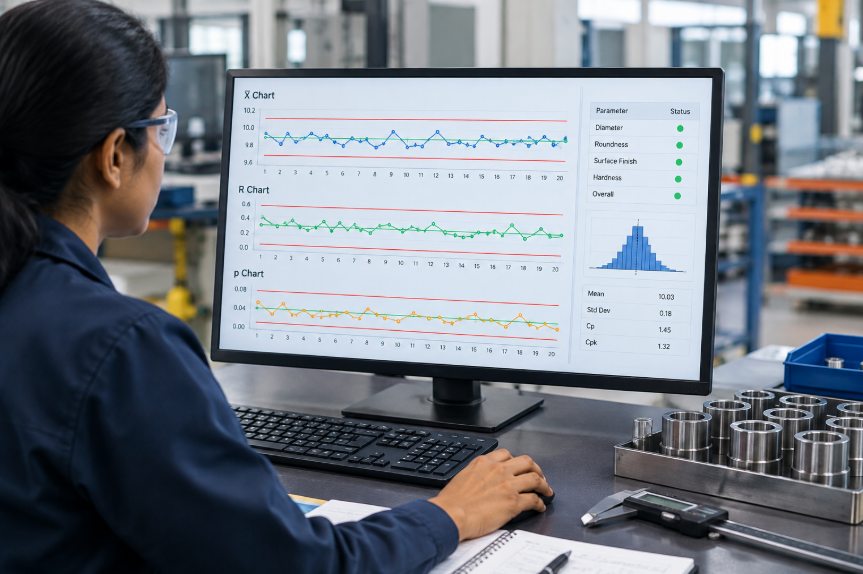
TL;DR: An X-bar and R chart is a pair of SPC control charts for measurement data taken in small subgroups. The X-bar chart tracks the subgroup average to show whether the process is centered. The R chart tracks the subgroup range to show whether its spread is steady. Together they separate normal variation from real change.
Key Takeaways
- Read R first: If spread is unstable, the X-bar limits cannot be trusted.
- Limits come from data: Control limits come from the process data, not from the drawing tolerance.
- Baseline size: Limits need a baseline of about 20 to 25 subgroups in real use.
- Signal, not a tweak: A point beyond a limit is a signal to look for a cause, not to adjust the machine at random.
What an X-bar R Chart Shows
Each subgroup is a few consecutive parts measured close together in time. Plot the subgroup mean on the X-bar chart and the subgroup range, the largest reading minus the smallest, on the R chart. The two charts are always read as a pair.
Center Line, UCL and LCL
| Chart | Center line | UCL | LCL |
|---|---|---|---|
| X-bar | Grand mean of subgroup means | Grand mean + A2 × R-bar | Grand mean − A2 × R-bar |
| R | R-bar, the average range | D4 × R-bar | D3 × R-bar |
The constants depend on subgroup size n. The process standard deviation is estimated as R-bar / d2.
| n | A2 | D3 | D4 | d2 |
|---|---|---|---|---|
| 2 | 1.880 | 0 | 3.267 | 1.128 |
| 3 | 1.023 | 0 | 2.574 | 1.693 |
| 4 | 0.729 | 0 | 2.282 | 2.059 |
| 5 | 0.577 | 0 | 2.114 | 2.326 |
| 6 | 0.483 | 0 | 2.004 | 2.534 |
Worked Example: An X-bar and R Chart for Bore Diameter
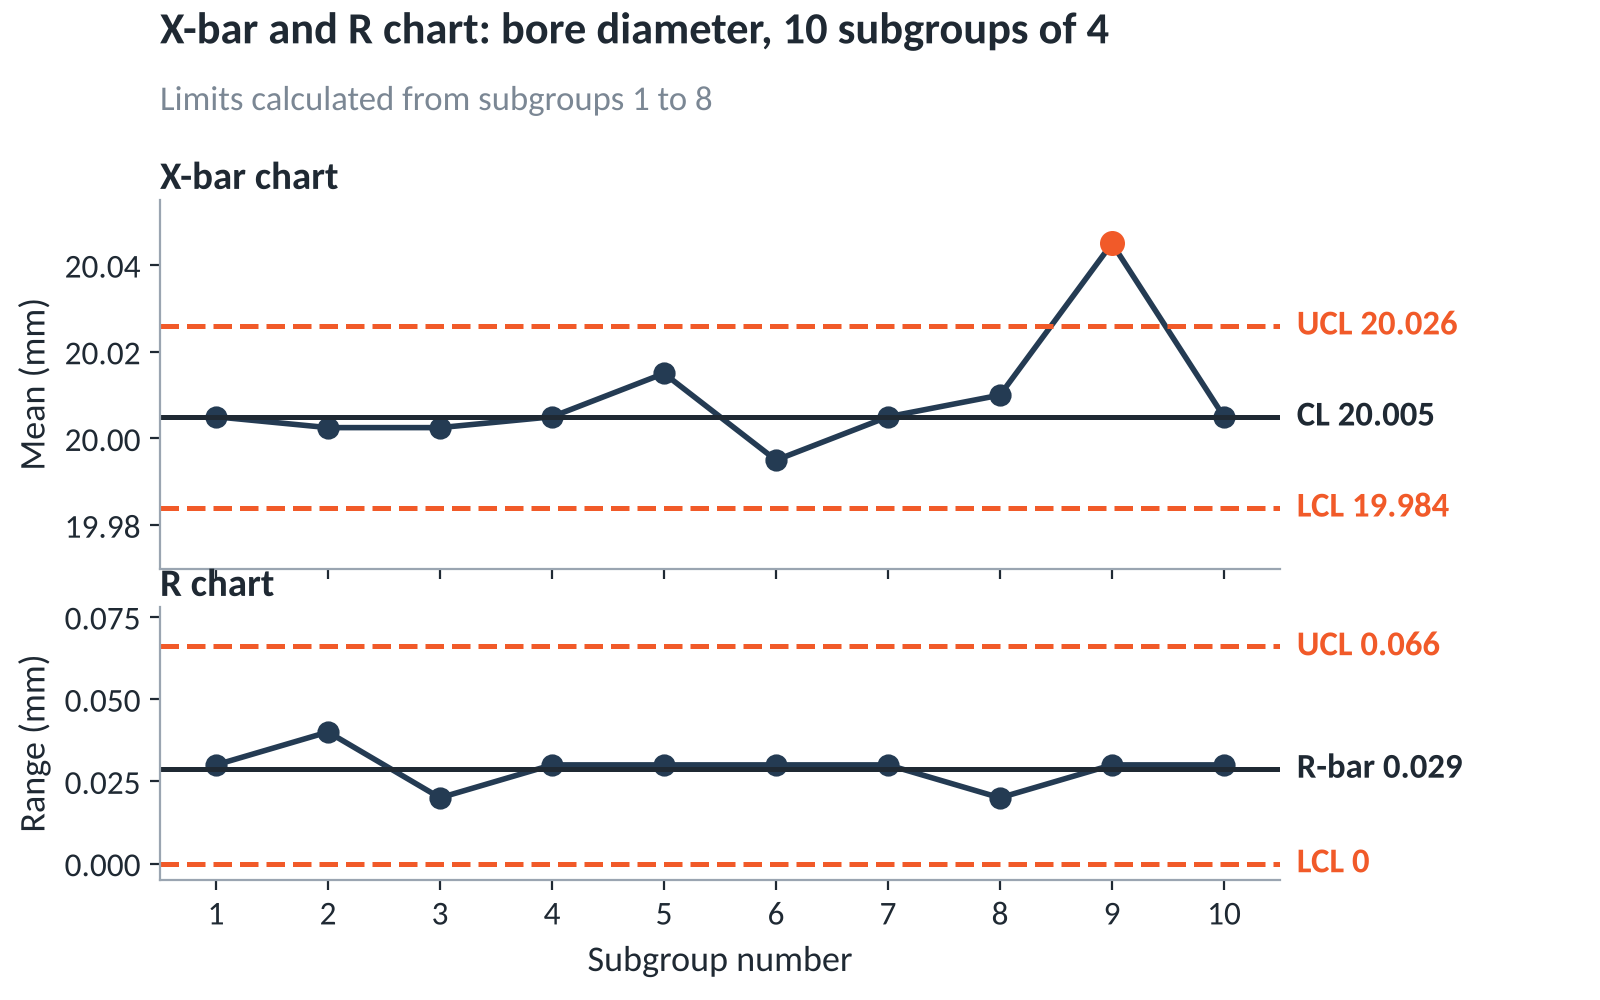
A bore is machined to 20.00 mm. Four consecutive parts are measured every hour. The first eight subgroups form the baseline. Subgroups 9 and 10 are new points.
| Subgroup | Readings (mm) | Mean | Range |
|---|---|---|---|
| 1 | 20.01, 19.99, 20.02, 20.00 | 20.0050 | 0.03 |
| 2 | 20.00, 20.01, 19.98, 20.02 | 20.0025 | 0.04 |
| 3 | 19.99, 20.00, 20.01, 20.01 | 20.0025 | 0.02 |
| 4 | 20.02, 20.00, 19.99, 20.01 | 20.0050 | 0.03 |
| 5 | 20.01, 20.03, 20.00, 20.02 | 20.0150 | 0.03 |
| 6 | 19.98, 20.00, 20.01, 19.99 | 19.9950 | 0.03 |
| 7 | 20.00, 20.02, 20.01, 19.99 | 20.0050 | 0.03 |
| 8 | 20.01, 20.00, 20.02, 20.01 | 20.0100 | 0.02 |
| 9 | 20.03, 20.05, 20.04, 20.06 | 20.0450 | 0.03 |
| 10 | 20.00, 19.99, 20.01, 20.02 | 20.0050 | 0.03 |
From subgroups 1 to 8, the grand mean is 20.005 mm and R-bar is 0.23 / 8 = 0.02875 mm. For n = 4:
- X-bar UCL = 20.005 + 0.729 × 0.02875 = 20.026
- X-bar LCL = 20.005 − 0.729 × 0.02875 = 19.984
- R chart UCL = 2.282 × 0.02875 = 0.066, and the LCL is 0
- Estimated standard deviation = 0.02875 / 2.059 = 0.014 mm
Reading an Out-of-Control Signal
Subgroup 9 has a mean of 20.045 mm, well above the X-bar UCL of 20.026. Its range of 0.03 is normal, so the spread did not change. The average shifted. Subgroup 10 returns to 20.005 mm, which suggests the cause was found and corrected, or was temporary. The next step is to check what changed before subgroup 9, such as a tool offset, a new material lot or a warm-up.
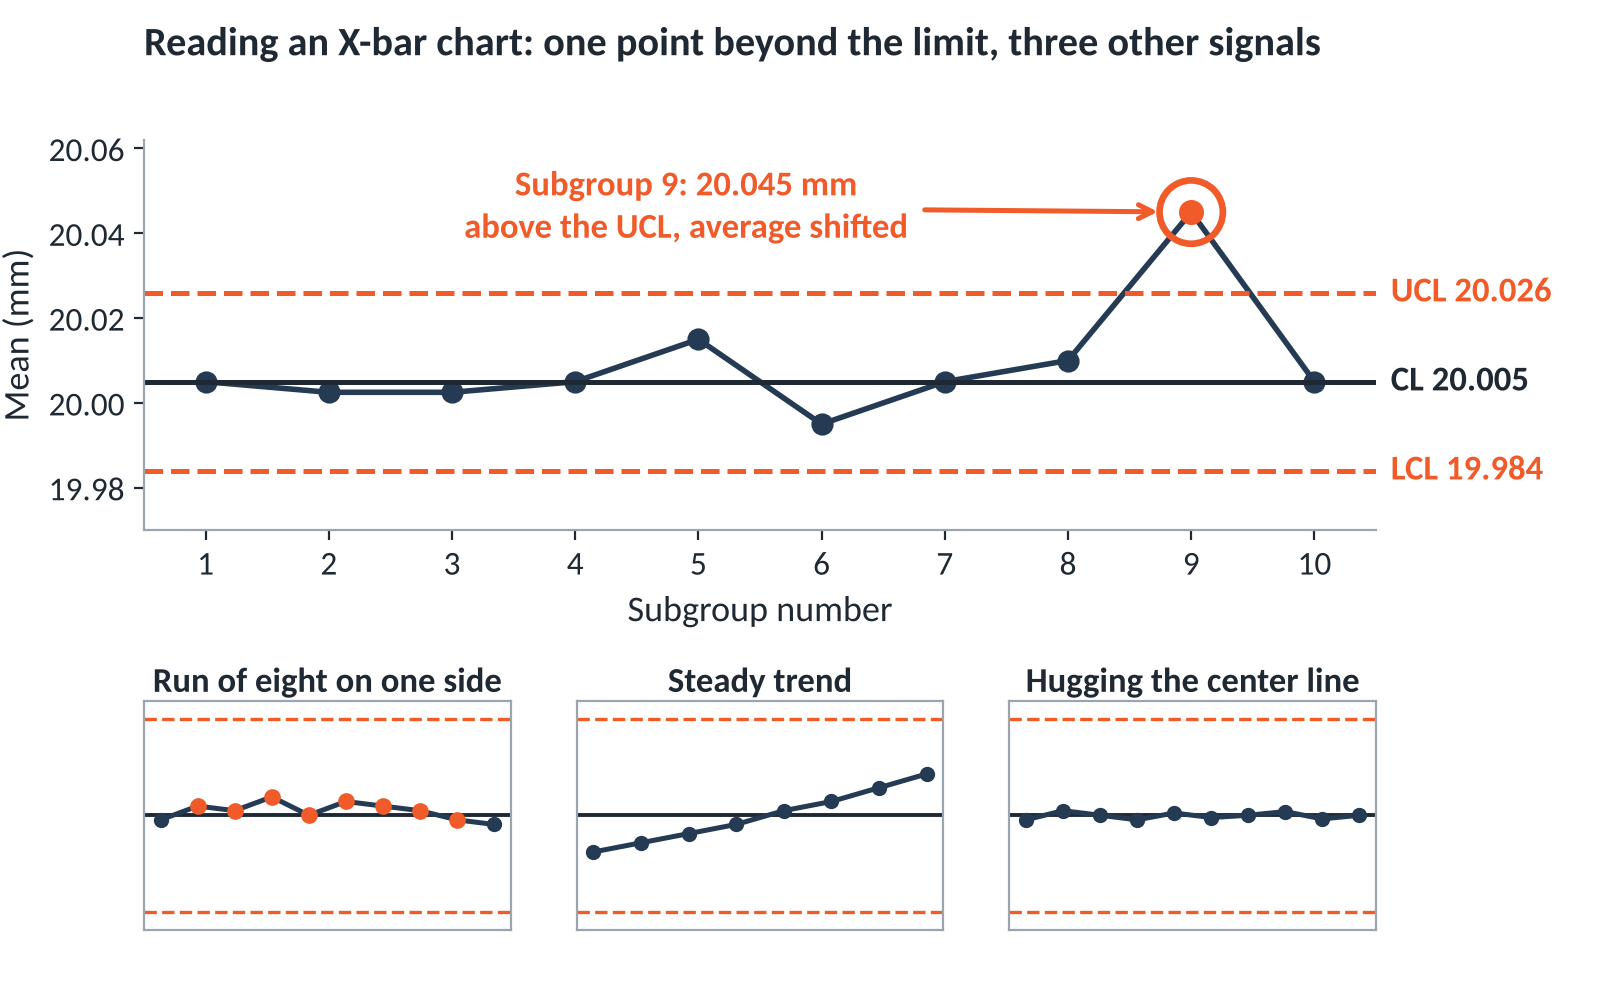
Signals to watch for:
- A point beyond UCL or LCL
- A run of seven to nine points on one side of the center line, depending on the rule set
- A steady run of points rising or falling
- Points clustered unusually close to the center line, which can mean mixed sources or wrong subgroups
“The most expensive habit in SPC is adjusting the machine every time a point moves. Most movement is common cause noise, and every needless adjustment adds variation.”
[Name], [Designation], [Company]
Using an X-bar R Chart on the Shop Floor
Charts are only as timely as their data. sfHawk connects to gauges and plots live SPC charts with quality alerts when a measurement drifts, and its process data is stored against parts, which helps when investigating a flagged subgroup with manufacturing traceability software. The broader method is covered in our guide to statistical process control.
Frequently Asked Questions
When should I use X-bar and R vs I-MR?
Use X-bar and R when you can take small rational subgroups of about 2 to 9 readings close together in time. Use an individuals and moving range (I-MR) chart when you only get one reading per time period, such as slow, costly or destructive tests, or batch processes.
What sample size is required?
Subgroups of 4 or 5 are common. For setting limits, collect at least 20 to 25 subgroups, since limits from only a handful are unreliable. Subgroups larger than about 9 are usually charted with X-bar and s instead.
What does the R chart tell me?
It shows whether the spread within subgroups is stable. A rising range means the process is becoming less consistent, even if the average looks fine.
References: AIAG, Statistical Process Control Reference Manual; NIST/SEMATECH e-Handbook, X-bar and R charts; Montgomery, Introduction to Statistical Quality Control.
Related Reading
- CNC Tool Life Monitoring and SPC Charts
- Cp and Cpk Explained: capability once the chart is stable
- Manufacturing process monitoring software
Get Started Today! Book a call with sfHawk | Email: inquiry@sfhawk.com | Phone: +91 91120 98351 | Website: www.sfhawk.com