How to calculate scrap rate, rework rate and first pass yield from one production run, and why output counts alone hide what poor quality costs.
TL;DR: Scrap rate is the percentage of units started that are thrown away. Rework rate is the percentage that need extra work before they can be sold. First pass yield, also called first time through, is the percentage made right with no scrap or rework. Output counts hide all three.
Key Takeaways
- Three metrics, three losses: Scrap rate, rework rate and first pass yield measure different losses. Tracking only one leaves the others out of sight.
- Rework is hidden cost: A reworked part still ships as good output, but it used labor, machine time and sometimes material twice.
- FPY drives OEE quality: First pass yield matches the quality factor in a strict OEE calculation.
- Context makes data actionable: Quality data is easier to act on beside the machine, tool and shift that made each part.
How to Calculate Scrap Rate, Rework Rate and First Pass Yield
Use the same denominator for all three, usually units started, and write it into the definition so lines and months stay comparable.
| Metric | Formula | What It Tells You |
|---|---|---|
| Scrap rate | Scrapped units / units started × 100 | Share of production thrown away |
| Rework rate | Reworked units / units started × 100 | Share that needed extra work to become sellable |
| First pass yield (first time through) | Units good with no rework / units started × 100 | Share made right the first time |
One Production Run, All Three Metrics
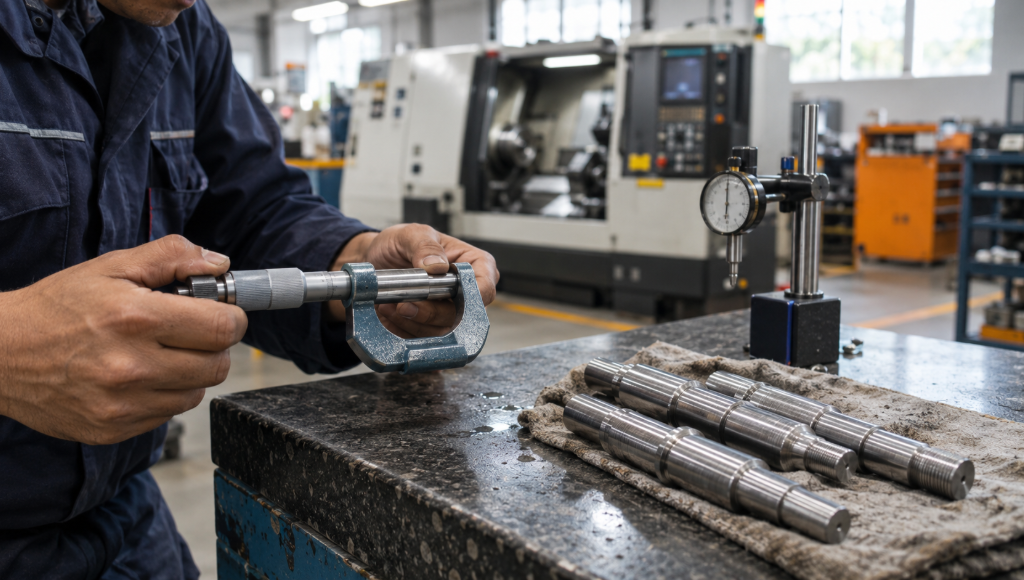
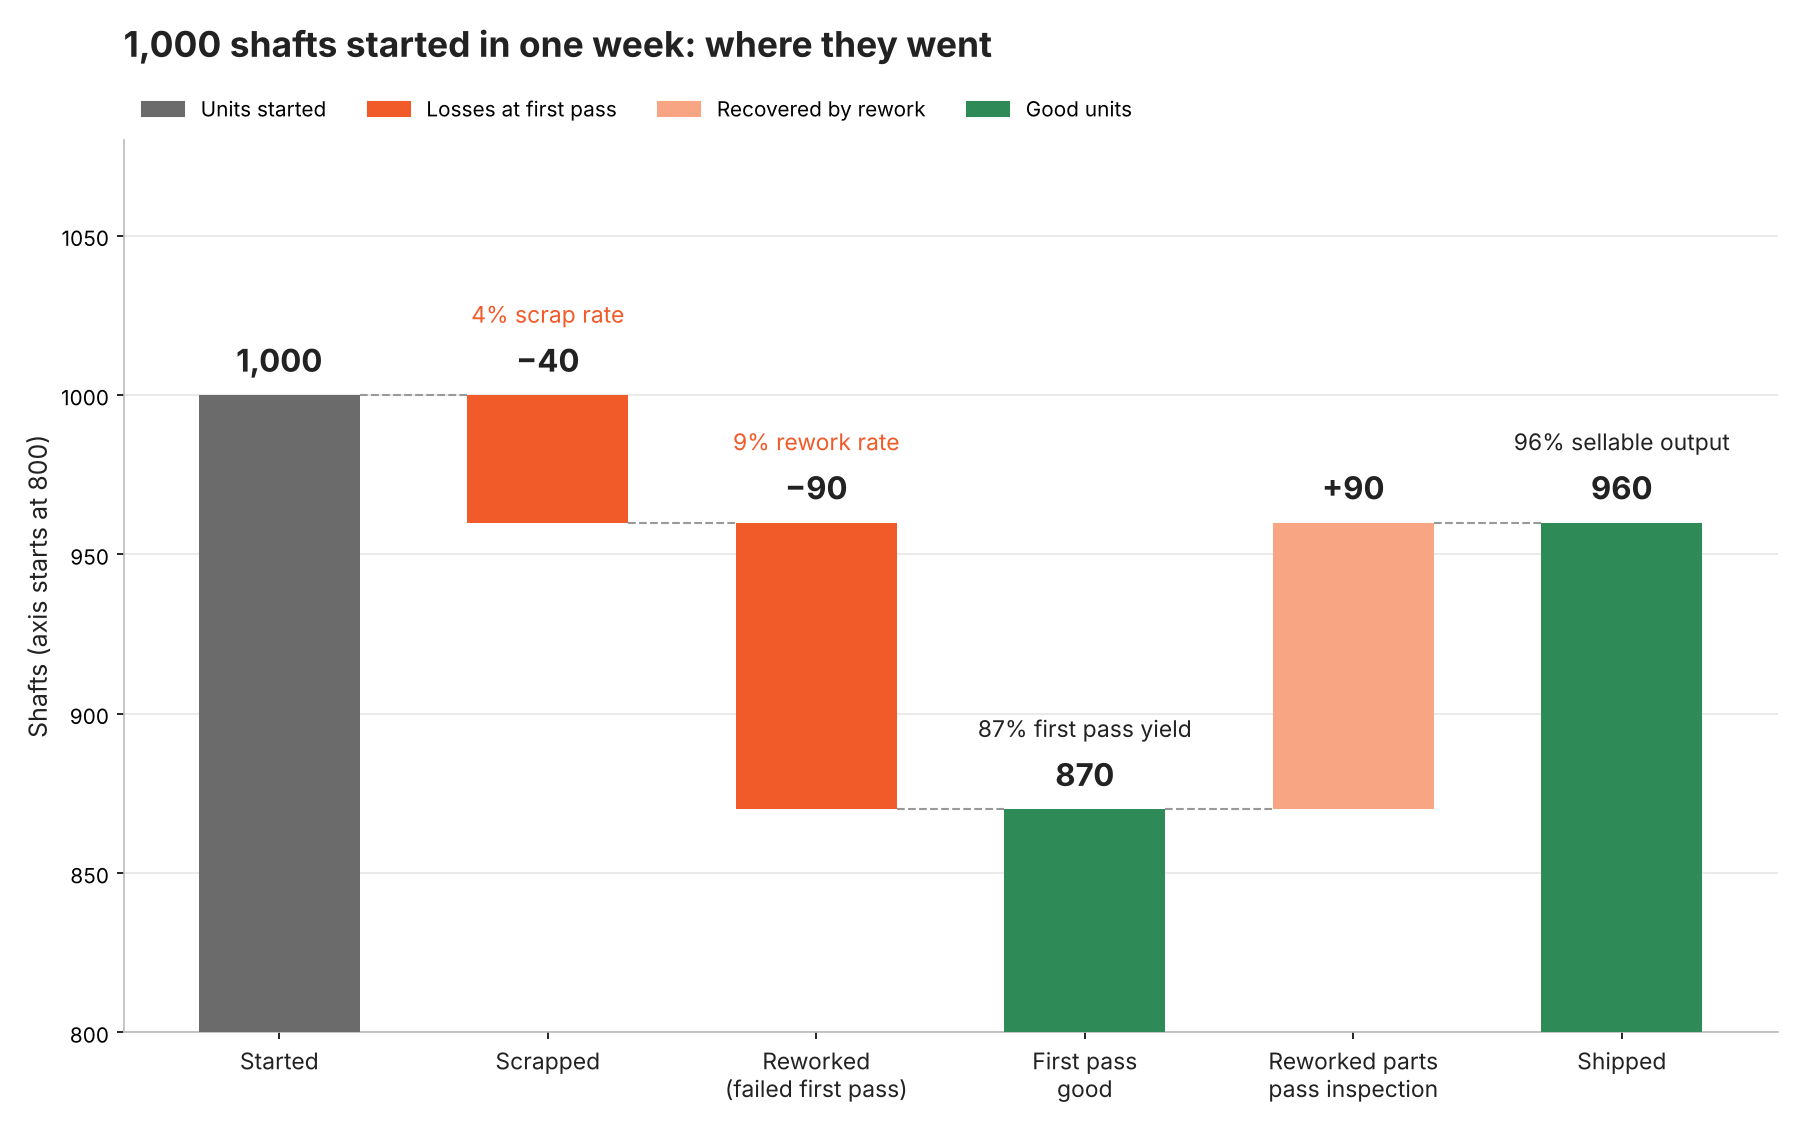
A CNC machining cell starts 1,000 shafts in one week. Inspection results:
- 870 shafts pass the first time
- 90 shafts fail, are reworked, and then pass
- 40 shafts are scrapped
Scrap rate = 40 / 1,000 = 4%
Rework rate = 90 / 1,000 = 9%
First pass yield = 870 / 1,000 = 87%
Sellable output is 960 shafts, or 96% of what was started. On a production board that looks healthy. First pass yield says 13 of every 100 shafts needed a second pass or went in the bin. Production monitoring software that records good, rework and rejected counts separately keeps that gap visible instead of folding it into a single output number.
What Each Metric Shows and What It Can Hide
| Metric | Reveals | Can Hide | Movement to Watch |
|---|---|---|---|
| Scrap rate | Material and machine time lost | Parts saved by rework before being scrapped | Falling is good. Check that parts are not just moving into rework. |
| Rework rate | Labor and capacity spent twice | Output looks normal because reworked parts still ship | Rising rework with flat scrap often means a process is drifting. |
| First pass yield | Share of parts right the first time | Which operation or cause is responsible | Falling yield with steady output means extra effort is absorbing the loss. |
Rising rework with flat scrap is often the first sign of process drift. Manufacturing process monitoring software shows how process parameters vary from part to part, so drift can be caught before it turns into scrap.
What Poor Quality Costs
Cost of poor quality is the money spent because parts were not right the first time. Internal failure costs cover scrap, rework, retesting and the machine time they use. External failure costs cover returns, warranty claims and customer penalties.
Scrap cost = 40 parts × Rs 1,200 = Rs 48,000
Rework cost = 90 parts × 20 min × Rs 10/min = Rs 18,000
Internal failure cost = Rs 66,000 for one week in one cell
That is Rs 66,000 for one week in one cell, before a single part reaches a customer.
Rolled Throughput Yield Across Several Operations
When a part passes through more than one operation, first pass yield at each step multiplies. Rolled throughput yield is that product. Three stations at 97%, 95% and 94% each look acceptable, yet the combined yield is much lower.
Rolled throughput yield = FPY1 × FPY2 × FPY3
= 0.97 × 0.95 × 0.94 = 86.6%
“A plant can hit its output target every day and still lose money on quality. Output tells you what left the line. First pass yield tells you how much effort it took to get there.”
[Name], [Designation], [Company]
Linking Scrap and Rework to Machine Conditions
A monthly scrap rate says something went wrong, rarely where. sfHawk connects to machines and gauges on the shop floor, so good, rework and rejected counts can be captured at the machine or inspection gauge instead of being written up at the end of a shift. Those counts feed the quality factor in OEE monitoring, which then reflects real first pass results.
Process traceability adds the second half. With manufacturing traceability software, key process parameters are recorded against each part or lot, so when scrap rises the team can compare the affected parts with the machine, tool, shift and process conditions behind them. Patterns such as scrap climbing after tool changes or on one spindle are easier to see when quality counts and machine monitoring data sit together. SPC charts show when a characteristic is drifting. Machine and traceability data help explain why.
Worn tools and degrading spindles are a common source of creeping scrap. Condition monitoring and preventive maintenance software flags these conditions before they show up as rejected parts. See a related example in our use case on improving cycle time through better spindle load management.
Frequently Asked Questions
What is the difference between FPY and yield?
Yield usually means good units out divided by units in, so reworked parts that pass count as good. First pass yield counts only units that passed with no rework. In the example, yield is 96% and first pass yield is 87%.
Do reworked parts count as good output?
They count as sellable output once they pass inspection, but not as first pass good units. Track them separately so the extra effort stays visible.
How does scrap rate affect OEE?
The quality factor in OEE is good units divided by total units. A strict calculation counts only first pass good units, so both scrap and rework reduce it. In the example, quality is 87%, not the 96% that scrap alone would suggest.
Related Reading
Quality losses are easiest to fix when they are measured where they happen. See how OEE monitoring captures the quality factor from real first pass counts, and how manufacturing traceability software traces each part back to its process conditions. To track good, rework and rejected counts by shift, explore production monitoring software. For the wider picture, read about smart factory and Industry 4.0 monitoring and the 10 manufacturing KPIs every plant manager should track.
Get Started Today! Book a call with sfHawk | Email: inquiry@sfhawk.com | Phone: +91 91120 98351 | Website: www.sfhawk.com