How line balancing removes bottlenecks, with a Yamazumi example, a before and after calculation and the role of measured cycle and idle time.
TL;DR: Line balancing is the process of distributing work across stations or operators so each one takes about the same time, at or just under takt time. It removes bottlenecks, cuts idle time and lets the whole line run at the pace of demand instead of the pace of its slowest station.
Key Takeaways
- The slowest station sets the pace: A line can only run as fast as its slowest station, so one overloaded station caps the output of every other station.
- Takt time is the target: The target for each station is takt time, the pace set by customer demand.
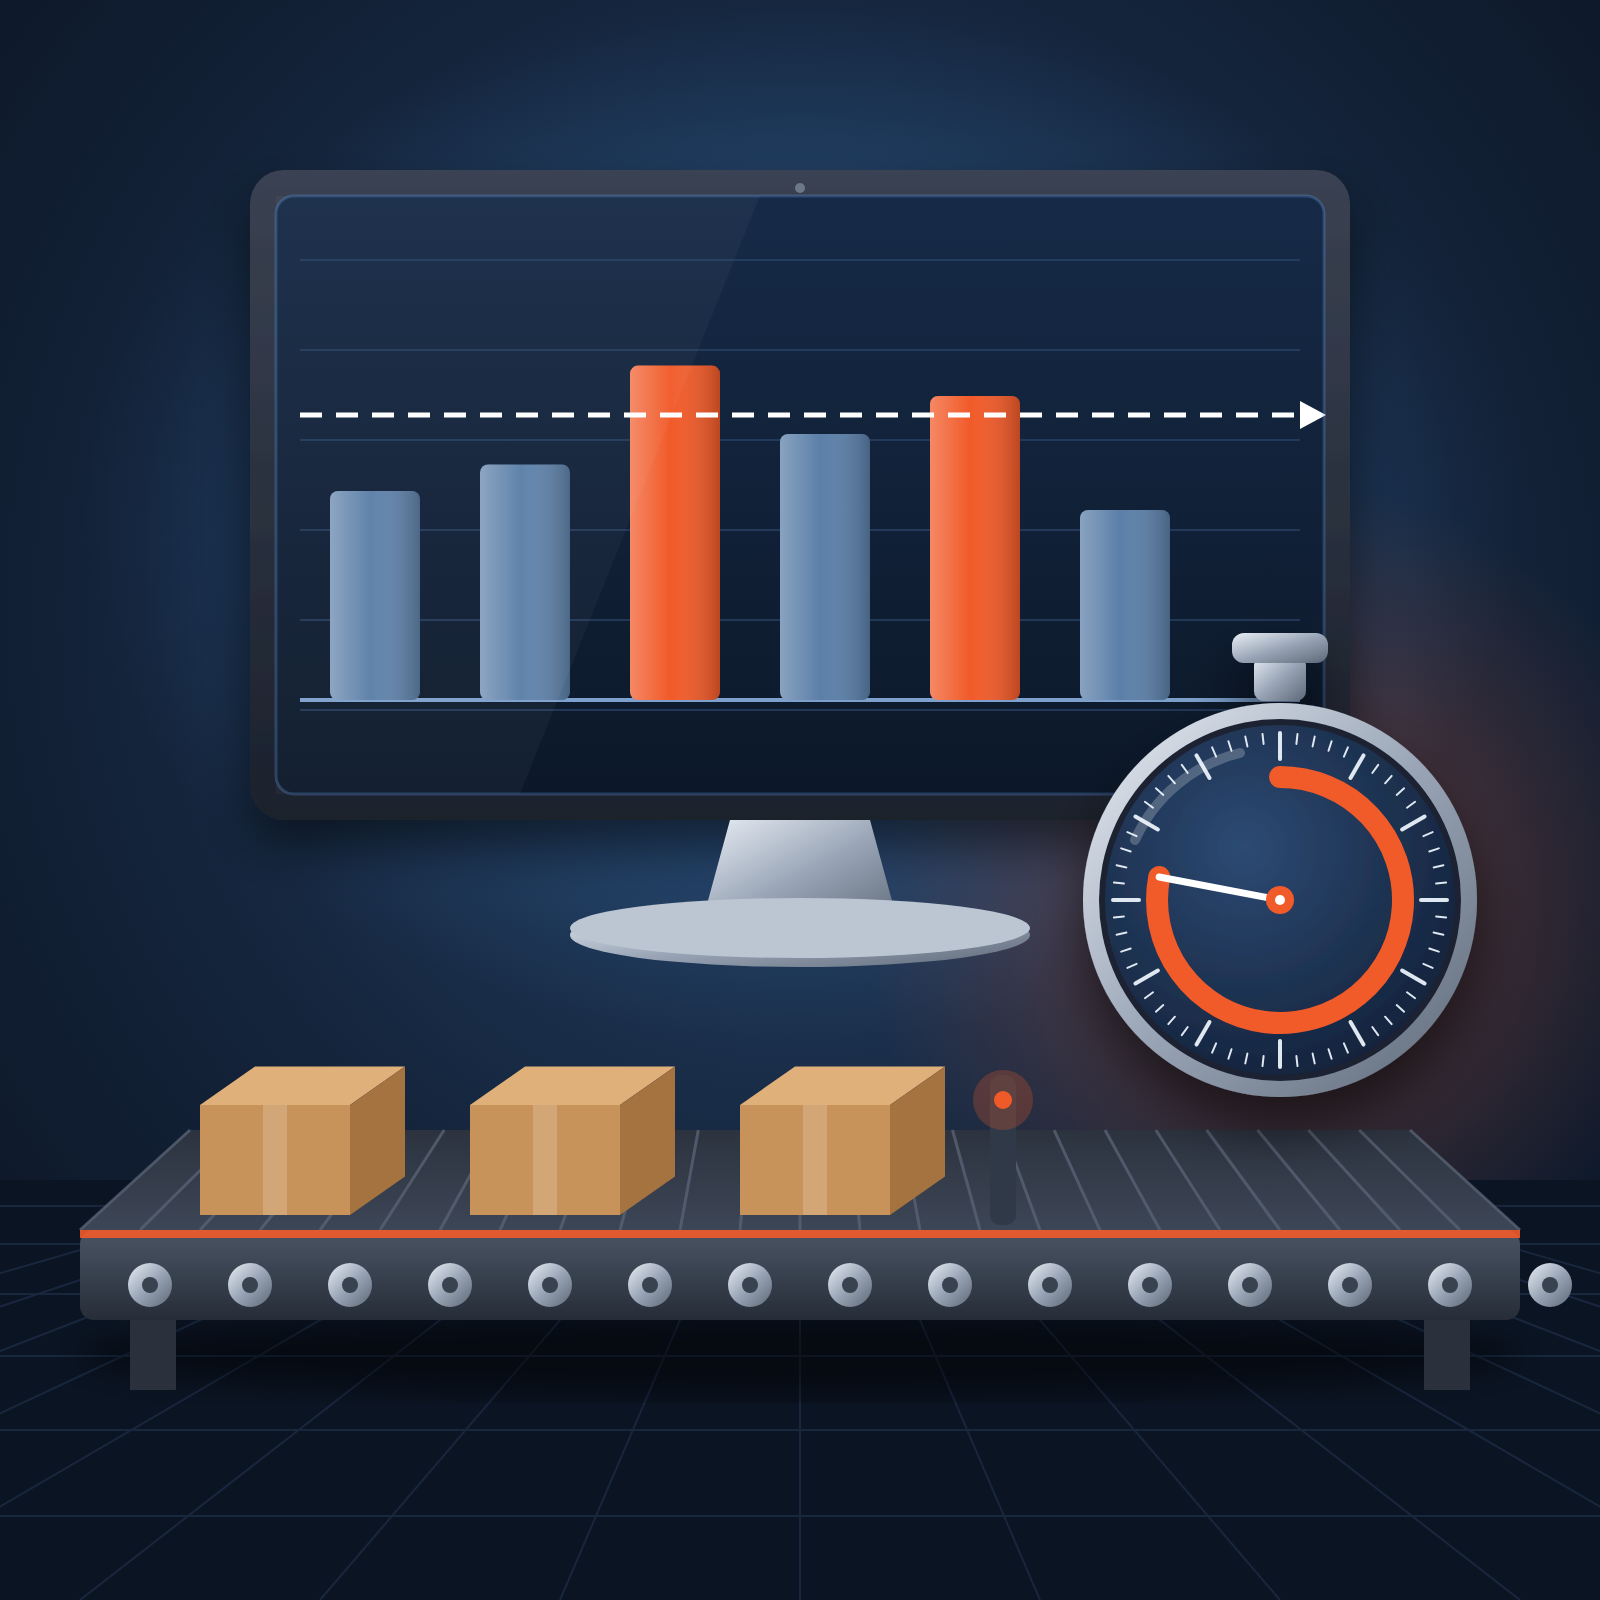
- Yamazumi makes imbalance visible: A Yamazumi chart stacks the work content of each station so imbalance is visible at a glance.
- Measured data beats standards: Standard times describe how work should go. Measured cycle and idle time show how it actually goes.
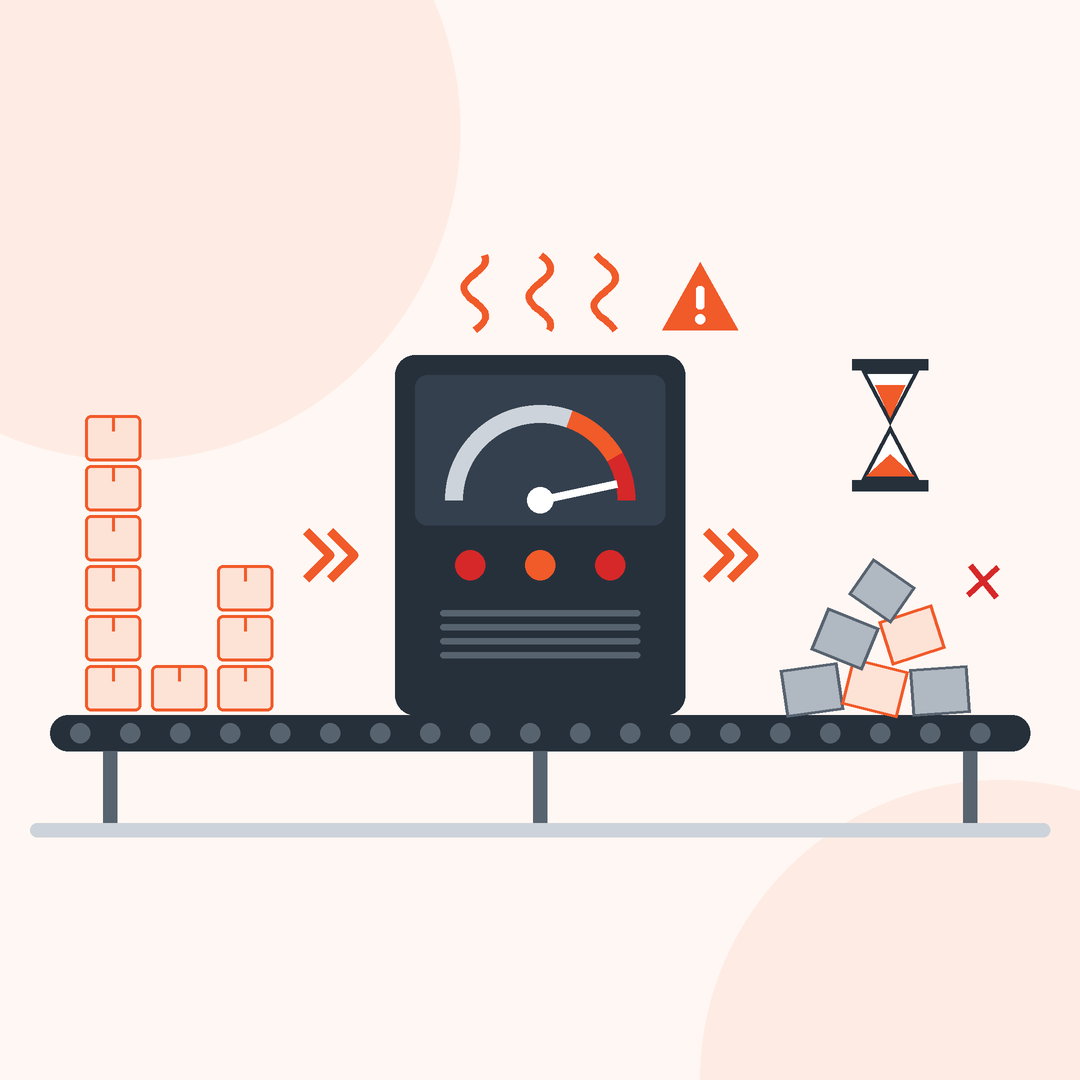
Signs a Line Is Out of Balance
| Symptom | What You See | Likely Cause |
|---|---|---|
| Starvation | A station waits for parts from upstream | Upstream station is slower or stops often |
| Blocking | A finished part cannot leave because downstream is full | Downstream station is the bottleneck |
| Idle time | Operators or machines wait while others are overloaded | Work content is uneven across stations |
| Bottleneck | WIP piles up in front of one station | That station’s cycle time exceeds takt |
Most of these symptoms show up first as machine waiting and idle time. Machine monitoring software records when each machine runs, waits or stands idle, so starvation and blocking can be traced to a specific station instead of a general feeling that the line is slow.
How to Balance a Line, Step by Step
- Calculate takt time: Available production time divided by customer demand.
- Measure actual cycle time: Time every station by observing it, not by reading the standard.
- Draw a Yamazumi chart: One stacked bar per station, with a line at takt time.
- Move tasks: Shift work from stations above takt to stations with spare time, keeping the process sequence intact.
- Re-measure: A balance that looks right on paper often shifts once work actually moves.
Takt time = available production time / customer demand
Steps 2 and 5 depend on reliable cycle time data. Production monitoring software tracks actual output and cycle time by station and shift, which keeps the chart grounded in what the line really does.
Before and After: A Five-Station Assembly Line
Demand requires one unit every 60 seconds, which is a takt time of 60 seconds. Station 3 is the bottleneck. In this assembly line balancing example, 12 seconds of work move from station 3 to station 1 and 12 seconds to station 5.
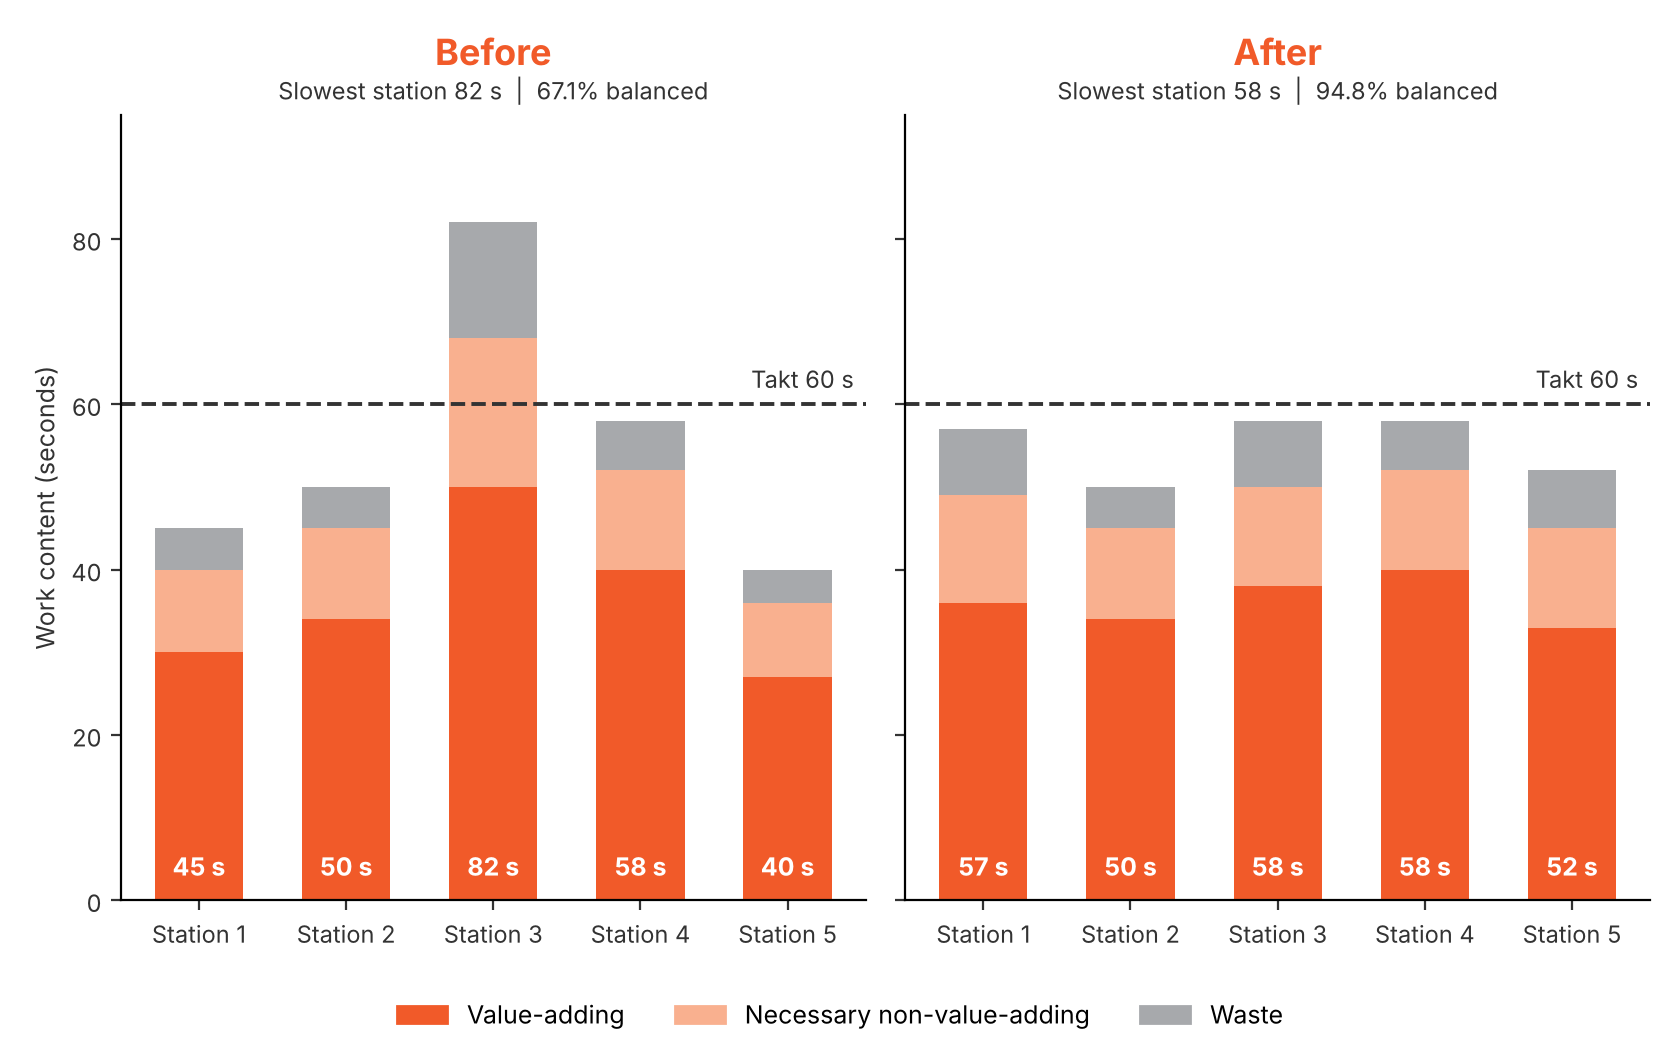
| Station | Before (sec) | After (sec) |
|---|---|---|
| Station 1 | 45 | 57 |
| Station 2 | 50 | 50 |
| Station 3 | 82 | 58 |
| Station 4 | 58 | 58 |
| Station 5 | 40 | 52 |
| Total work content | 275 | 275 |
| Slowest station | 82 | 58 |
| Line capacity per hour | 43.9 units | 62.1 units |
| Balance efficiency | 67.1% | 94.8% |
Balance efficiency = total work content / (number of stations × slowest station time)
Before = 275 / (5 × 82) = 67.1%
After = 275 / (5 × 58) = 94.8%
The total work did not change. It was redistributed, and capacity rose from 43.9 to 62.1 units an hour, enough to meet the 60-unit demand. A two-second margin is thin, so a real line would also look at stoppages and variation. OEE monitoring shows how much availability and performance loss sits on each station, which tells you whether that margin will hold across a full shift.
When Cellular Manufacturing Changes the Approach
In cellular manufacturing, machines and operators are grouped in a compact cell, often U-shaped, to make a family of similar parts. Balancing no longer means shifting tasks between fixed stations. It means designing how many operators the cell needs and the loop each one walks, so that operator work content matches takt time.
In machine shops, where machine cycle times are fixed by the process, balancing usually comes down to matching machine capacity and operator workload. Manufacturing process monitoring software helps here by showing how process parameters and cycle times vary from part to part within the cell.
“Standard times are what the work should take on a good day. Put a stopwatch on the line and you find the real cycle time is longer and different every shift, and that is where the imbalance hides.”
[Name], [Designation], [Company]
Why Measured Cycle and Idle Time Beat Standard Times
Standard times are set once, often under ideal conditions. They miss minor stops, waiting for material, slow changeovers and operators searching for tools. A line balanced on standards can still show a queue in front of one station every shift.
sfHawk captures how long each machine runs, waits and stands idle, together with actual cycle time and output. That puts measured numbers on the Yamazumi chart. A station that averages 74 seconds against a 62-second standard, or a machine that waits on parts for 20 minutes an hour, shows up as data instead of an opinion. Teams can also confirm after a rebalance whether the change held.
When WIP keeps piling up in front of one station, manufacturing traceability software shows where each part is waiting and for how long. See this approach in practice in our use cases on improving cycle time through better spindle load management and smarter, automated traceability and management of WIP.
Frequently Asked Questions
What is the difference between line balancing and capacity planning?
Line balancing evens out work between the stations of an existing line so it can reach its target rate. Capacity planning decides how much total capacity, in machines, people and shifts, is needed to meet demand. Balancing is often the cheaper first step before adding capacity.
How is takt time used in line balancing?
Takt time is the target. Each station’s work content should be at or just under takt. Stations above it are bottlenecks that need work moved away, and stations well below it have spare time that can absorb work.
What is a Yamazumi chart?
A Yamazumi chart is a stacked bar chart of the work content at each station, usually split into value-adding work, necessary non-value-adding work and waste, with takt time drawn as a line across the bars.
Related Reading
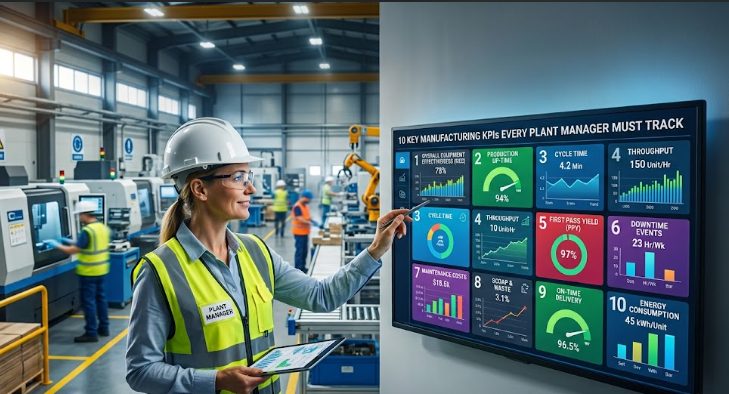
A balanced line stays balanced only when cycle time and idle time are visible as they happen. See how machine monitoring software and production monitoring software track run, wait and idle time by station, and how OEE monitoring shows which losses hold a station back. To cut the stoppages that eat into a thin takt margin, explore condition monitoring and preventive maintenance software. For the wider picture, read about smart factory and Industry 4.0 monitoring, the setups and production scheduling use case and the 10 manufacturing KPIs every plant manager should track.
Get Started Today! Book a call with sfHawk | Email: inquiry@sfhawk.com | Phone: +91 91120 98351 | Website: www.sfhawk.com