The Cpk formula, how Cp differs from Cpk, what the values mean and how control limits differ from specification limits, with a worked example.
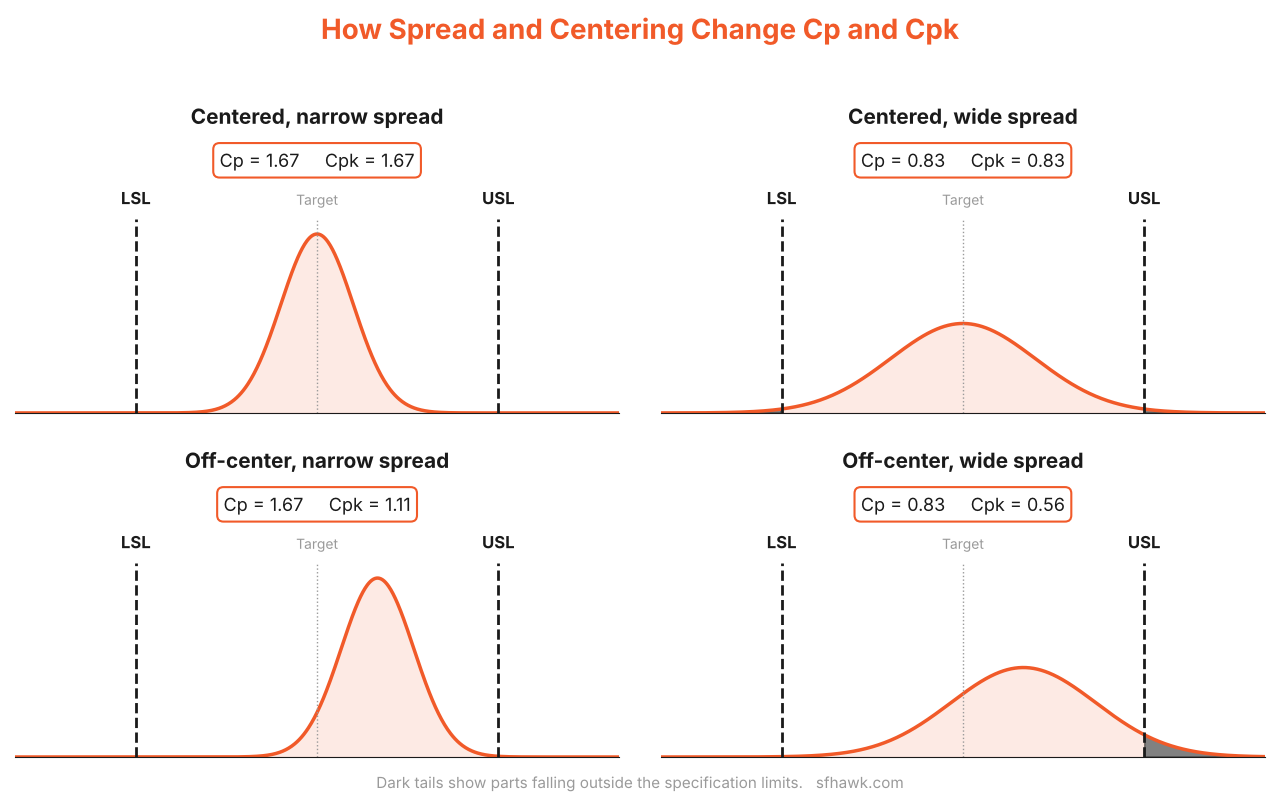
TL;DR: Cp and Cpk are process capability indices. Cp compares the width of your tolerance to the natural spread of your process and ignores where the process is centered. Cpk adjusts for centering by measuring the distance from the mean to the nearer specification limit, in units of three standard deviations.
Key Takeaways
- Could vs does: Cp shows whether the process spread could fit inside the tolerance. Cpk shows whether it does, given where the process is centered.
- Cpk is never higher than Cp: A large gap between them points to a centering problem.
- Stability comes first: A Cpk value is only meaningful when the process is stable and the data are roughly normal.
- Two different limits: Control limits describe what the process does. Specification limits describe what the customer needs.
The Cpk Formula and the Cp Formula
| Index | Formula | In Plain Terms |
|---|---|---|
| Cp | (USL − LSL) / 6σ | Tolerance width divided by process spread |
| Cpk | The smaller of (USL − mean) / 3σ and (mean − LSL) / 3σ | Distance to the nearer limit divided by half the spread |
The process capability index you report depends on the data behind it, so collect it from a stable process. USL and LSL are the upper and lower specification limits. The symbol σ (sigma) is the estimated standard deviation of the process, normally taken from within-subgroup variation. Capturing that data automatically from gauges and inspection devices is where manufacturing process monitoring helps, since manual readings are often too few and too late.
Process Capability Analysis: A Worked Example with Shaft Diameter
A shaft is specified at 25.00 mm plus or minus 0.05 mm, so LSL is 24.95 mm and USL is 25.05 mm. Measured data give a process mean of 25.01 mm and a standard deviation of 0.012 mm.
Cp = 0.10 / (6 × 0.012) = 1.39
Upper side: (25.05 − 25.01) / (3 × 0.012) = 1.11
Lower side: (25.01 − 24.95) / (3 × 0.012) = 1.67
Cpk = the smaller value = 1.11
The spread is narrow enough, with a Cp of 1.39, but the process runs 0.01 mm above target and sits close to the upper limit. Re-centering at 25.00 mm would raise Cpk to 1.39 with no change in spread.
Cp vs Cpk Side by Side
| Aspect | Cp | Cpk |
|---|---|---|
| Measures | Spread against tolerance | Spread and centering |
| Uses the process mean | No | Yes |
| Can be negative | No | Yes, if the mean is outside a specification limit |
| Tells you | What the process could achieve if centered | What the process is achieving now |
What the Numbers Mean
- Below 1.00: The process is producing nonconforming parts.
- 1.00 to 1.33: Marginal. Small shifts will produce defects.
- 1.33 and above: A common minimum for ongoing production.
- 1.67 and above: Often requested for initial studies on new processes.
These thresholds follow guidance in the AIAG Production Part Approval Process and Statistical Process Control reference manuals, which are widely used in automotive supply chains. Always confirm the figure your own customer requires.
Control Limits vs Specification Limits
| Aspect | Specification Limits | Control Limits |
|---|---|---|
| Set by | Customer or design drawing | Calculated from process data |
| Question answered | Is the part acceptable? | Is the process behaving consistently? |
| Behavior | Fixed | Move when the process changes |
| Used in | Cp and Cpk | Control charts in SPC |
A process can sit inside its control limits and still make out-of-specification parts, and a process that meets specification can be out of control, which is a warning that capability will not last.
“A Cpk on its own means very little. If the process is not stable, that number describes a past you will not see again, so check the control chart before you trust the capability.”
[Name], [Designation], [Company]
Investigating Capability Drift on the Shop Floor
Capability studies and SPC tell you a characteristic has moved. They do not tell you why. sfHawk does not replace SPC. It adds context to it. The platform connects to gauges and inspection devices and records process parameters against each part through manufacturing traceability software, so a team looking at a falling Cpk can check what changed on the machine around the same time using machine monitoring.
Drift that appears after warm-up, on one spindle, after a tool change or on one shift points to a specific cause to check. Because parameters stay tied to part identity, the investigation does not depend on memory or paper records. See how this works in practice in our part and process parameters traceability use case.
Frequently Asked Questions
Is a Cpk of 1.33 good?
Yes, 1.33 is a widely used minimum for ongoing production, equal to a process whose nearer limit sits four standard deviations from the mean. Many customers expect 1.67 for new processes, so check the requirement that applies to you.
Can Cpk be negative?
Yes. If the process mean falls outside a specification limit, the distance to that limit is negative and so is Cpk. It means more than half of the parts are out of specification.
Cp vs Pp and Ppk: what is the difference?
Cp and Cpk use within-subgroup variation, which reflects short-term capability. Pp and Ppk use the overall standard deviation of all the data, which also captures shifts between subgroups. A large gap between Cpk and Ppk suggests the process is not stable.
References
- AIAG Statistical Process Control (SPC) Reference Manual
- AIAG Production Part Approval Process (PPAP) Manual
- ISO 22514 series on capability and performance in process management
Related Reading
Capability numbers are easiest to trust when the process data behind them is captured in real time. See how manufacturing process monitoring tracks critical parameters as parts are made, and how manufacturing traceability software and batch and lot traceability link every measurement to the part, machine and shift that produced it. For the output side, explore production monitoring software and OEE monitoring, where quality losses feed directly into OEE. For the wider picture, read the 10 manufacturing KPIs every plant manager should track.
Get Started Today! Book a call with sfHawk | Email: inquiry@sfhawk.com | Phone: +91 91120 98351 | Website: www.sfhawk.com