Assembly Line Monitoring: Finding the Bottleneck Station in Real Time
TL;DR: On a multi station assembly line, the slowest station sets the pace for the entire line, but shift end reports only show total output, not which station is holding everyone else back. Real-time assembly line monitoring tracks cycle time station by station, so the actual bottleneck is visible while the shift is still running, not the next morning.
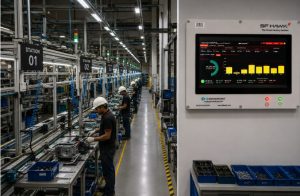
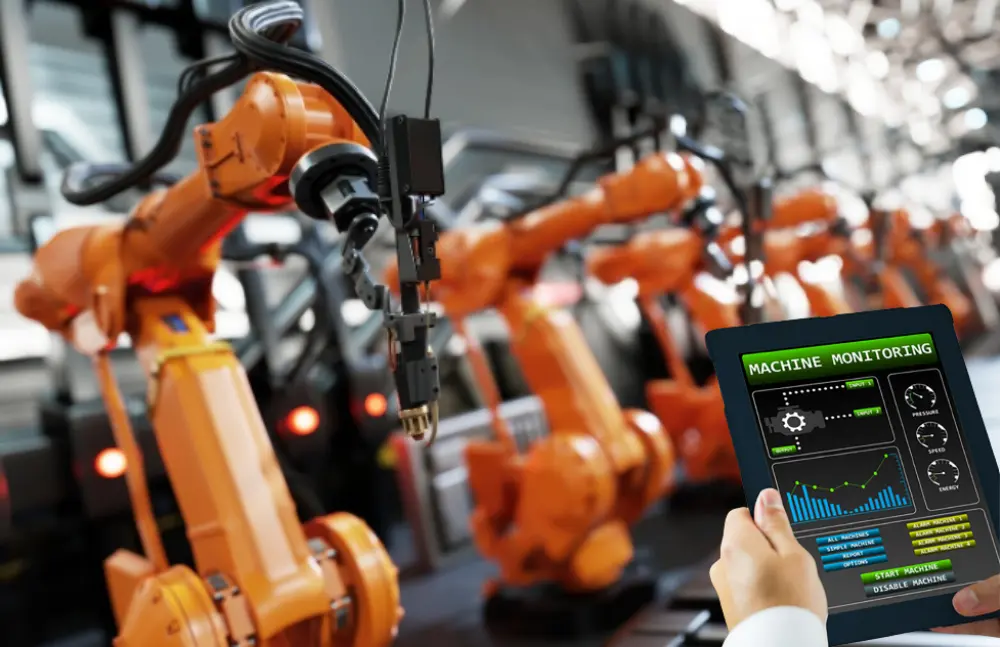
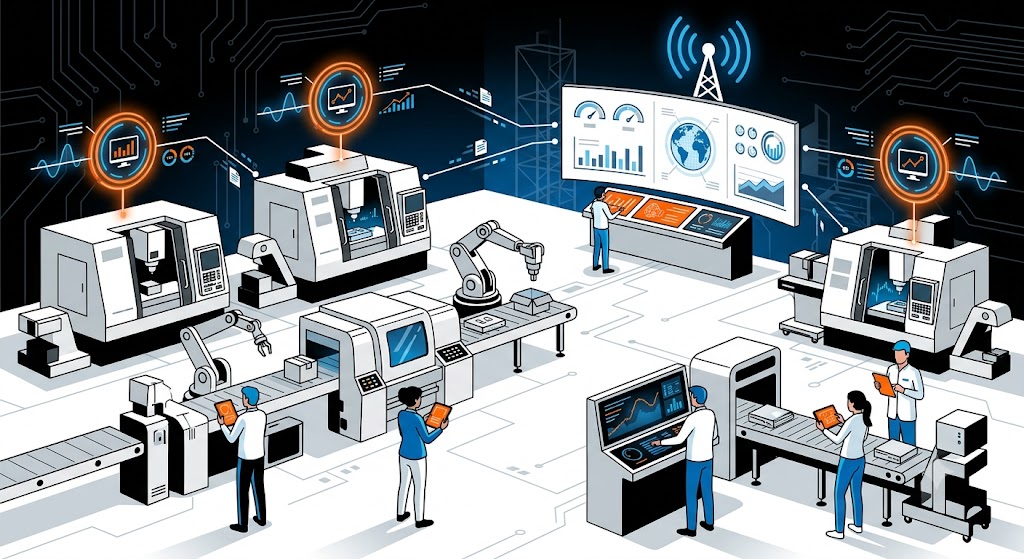
An assembly line is only as fast as its slowest station, a principle known as the bottleneck or constraint station. The problem is that a shift end production report shows total units built, not which of the ten or twenty stations on the line is actually limiting output. Teams end up debating which station is the problem based on opinion rather than data. Assembly line monitoring solves this by capturing cycle time at each station individually and comparing it against the line’s target takt time in real time. Solutions like sfHawk build this station-level visibility directly into the shop floor dashboard.
Station-Level Data vs. Line-Level Output
Takt time is the maximum time allowed per station to meet a required output rate, calculated by dividing available production time by customer demand. A line can hit its overall output target on a given shift while still hiding a chronically slow station, because faster stations downstream simply wait, and that waiting does not show up unless it is measured separately.
| Data Point | Line-Level Report (Traditional) | Station-Level Monitoring |
| Total units built | Visible | Visible |
| Which station is the bottleneck | Not visible | Visible per station |
| Station-to-station wait time | Not visible | Visible |
| Time of day bottleneck shifts | Not visible | Visible |
Line Balancing Gets Real Data Instead of Estimates
Line balancing is the process of distributing work content evenly across stations so no single station becomes a constraint, a concept rooted in lean manufacturing practices such as those outlined in the Lean Enterprise Institute’s lexicon. Line balancing exercises are traditionally done with time and motion studies taken on a handful of sample cycles, useful but a snapshot. Continuous station level monitoring instead shows how cycle time actually varies across a full shift, across operators, and across different product variants running on the same line, which is a much larger and more honest data set to rebalance against.
Andon and Real-Time Escalation
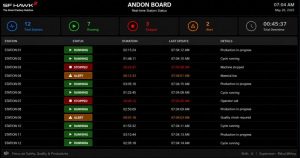
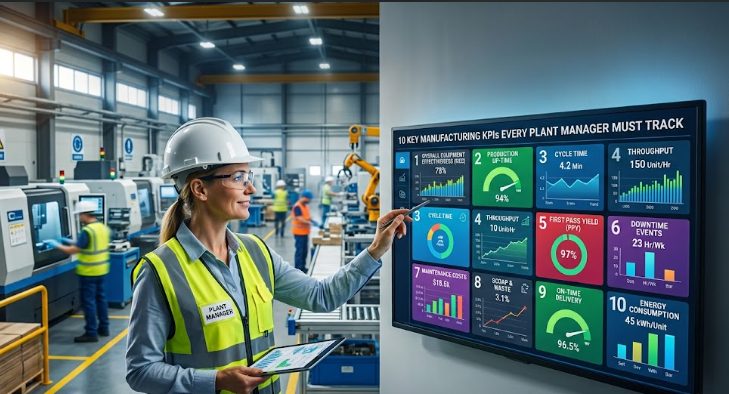
Andon is a manufacturing signal, traditionally a physical light or cord pull, used to flag a stoppage or quality issue so it gets addressed immediately rather than at the next scheduled check. A production monitoring display system puts this logic on a digital dashboard. When a station’s cycle time exceeds its target or a stop is detected, the line and the relevant supervisor see it within seconds, rather than the issue only surfacing in an end of shift meeting.
From Assembly Line Data to Smart Factory Automation
Individually, station level monitoring fixes one line. Connected across every line in a plant, it becomes part of a broader smart manufacturing approach, where scheduling, maintenance, and quality systems all draw from the same real-time production data instead of separate, disconnected reports. That connected layer is what distinguishes smart factory automation from simple line monitoring: the data is not just displayed, it is fed into decisions elsewhere in the plant, such as sequencing the next job based on which line is actually available right now. Explore how this works in practice at www.sfhawk.com.
Get Started Today! Book a call with sfHawk | Email: inquiry@sfhawk.com | Phone: +91 91120 98351 | Website: www.sfhawk.com