What SPC is, how control charts separate normal variation from real change, and how to build an X-bar and R chart.
TL;DR: Statistical process control (SPC) is a method of monitoring a process with control charts so you can tell normal variation from a real change. Paired with manufacturing process monitoring, it lets operators act while parts are still being made, instead of sorting good from bad afterwards. Use it on any repeating process with a characteristic you can measure.
Key Takeaways
- Process, not part: SPC watches the process, not the part, so change is flagged early.
- Two kinds of variation: Common cause variation is normal noise. Special cause variation has a specific source worth chasing.
- Chart by data type: Measurements suit X-bar and R, counts suit p, np, c and u.
- Timeliness matters: Charts only help if they are timely. Automatic data capture shortens the gap between drift and response.
When to Use SPC
Use SPC where a process repeats, a characteristic can be measured and drift is costly, such as critical dimensions or fastening torque. Recording those values against each part with manufacturing traceability software lets you trace any out-of-control subgroup back to the parts it produced.
Common Cause vs Special Cause Variation
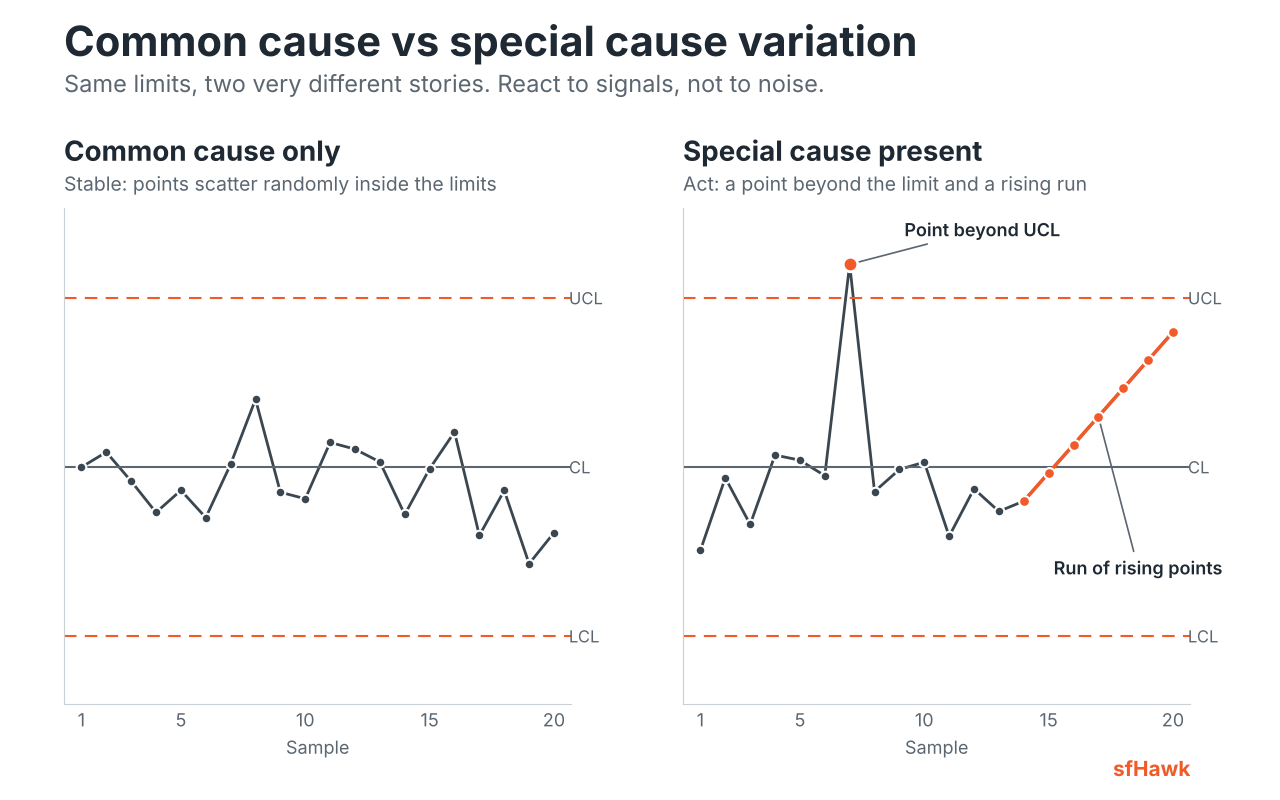
Every process varies. Common cause variation is steady background noise from many small sources, such as material differences, temperature and normal tool wear, all of which machine monitoring software can capture as it happens. A process with only common causes is stable.
Special cause variation comes from something specific, such as a worn insert, a new material lot or a loose fixture. It shows up as points beyond the limits or as patterns inside them. Shewhart drew this distinction in the 1920s. Reacting to common cause noise makes a process worse. Ignoring special causes lets it drift.
Which SPC Control Chart Should You Use?
| Chart | Data type | Use it for |
|---|---|---|
| X-bar and R | Measurements, subgroups of about 2 to 9 | A diameter sampled five parts at a time |
| Individuals and moving range | One measurement at a time | One reading per batch |
| p and np | Defective parts, as a proportion or count | Rejects per lot |
| c and u | Count of defects | Defects per panel or per meter of weld |
Worked Example: An X-bar and R Chart
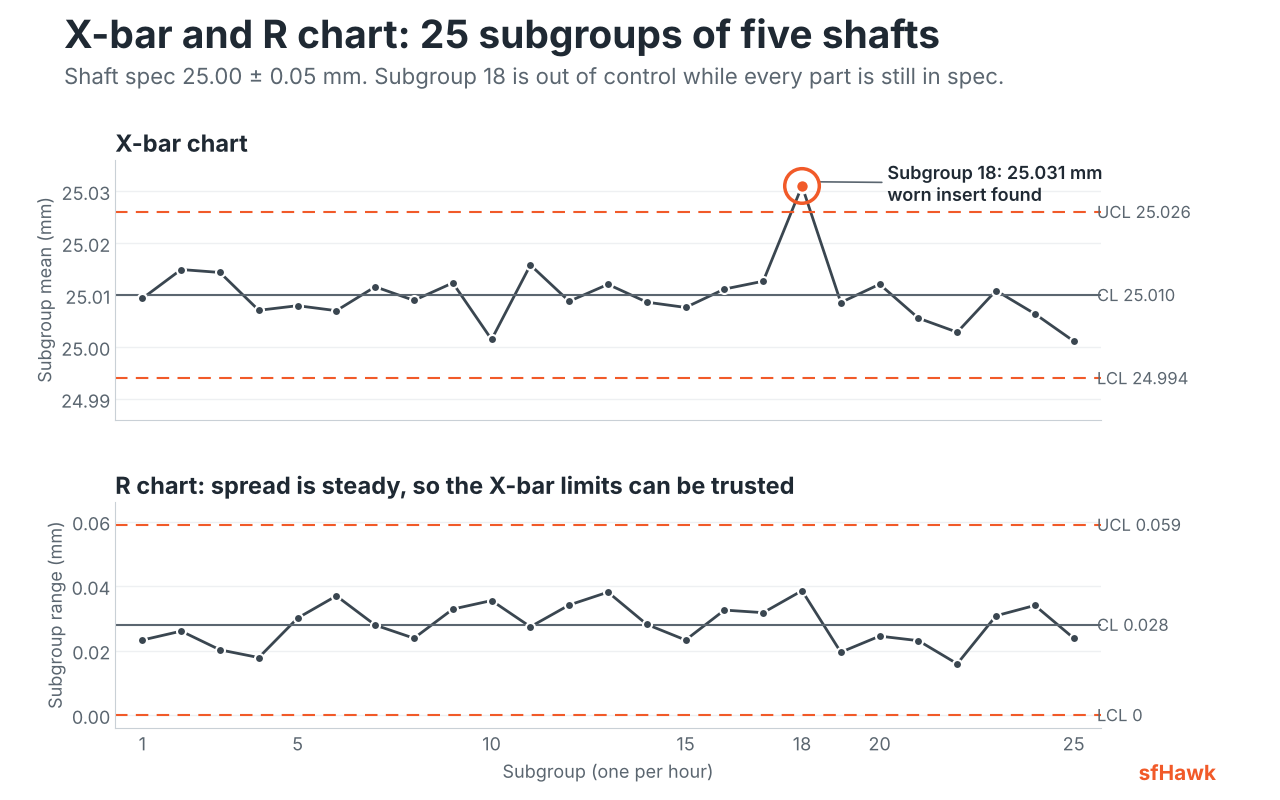
A CNC lathe turns a shaft specified at 25.00 mm plus or minus 0.05 mm. Each hour, an operator measures five consecutive shafts. After 25 subgroups, the average of the means is 25.010 mm and the average range is 0.028 mm. For subgroups of five, A2 = 0.577, D3 = 0 and D4 = 2.114.
| Chart | Center line | Upper limit | Lower limit |
|---|---|---|---|
| X-bar | 25.010 mm | 25.010 + 0.577 × 0.028 = 25.026 | 25.010 − 0.016 = 24.994 |
| R | 0.028 mm | 2.114 × 0.028 = 0.059 | 0 (none for subgroups of five) |
Check the R chart first, since unstable spread makes the average limits unreliable. Here it is steady.
Subgroup 18 averages 25.031 mm, above the upper control limit. That is a special cause signal: the average has shifted. The operator finds a worn insert. Every shaft is still inside the 25.05 mm specification limit, yet the chart flagged the shift before any part was rejected. That early warning is the point.
Other signals include seven to nine points in a row on one side of the center line, depending on the rule set, or a steady trend. The same average range gives a standard deviation of 0.028 / 2.326 = 0.012 mm, as used in our Cp and Cpk guide.
Process Control vs Product Inspection
Inspection sorts parts after the work is done. Process control acts while the work is happening. Deming argued that inspection is late and costly because it finds defects without preventing them.
“Inspection tells you what you already made. A control chart tells you what the process is about to make, while you can still act.”
[Name], [Designation], [Company]
Making Statistical Process Control Work with Real-Time Data
SPC works when data arrives while it can still change the outcome. Readings keyed in later turn a chart into history. sfHawk‘s manufacturing process monitoring connects to machines and gauges and plots live SPC charts, with integrated quality alerts when a parameter drifts. Limits can be set for key parameters, and values are stored against parts.
When a subgroup is flagged, the team can see which machine, tool, shift and conditions produced it instead of relying on memory. A chart shows that something changed. Machine and process data help show what.
Frequently Asked Questions
What is the difference between SPC and SQC?
Statistical quality control (SQC) is the broader field. It includes SPC, which monitors a process with control charts, and acceptance sampling, which inspects lots to accept or reject them.
What is the difference between control limits and specification limits?
Control limits are calculated from process data and show what the process is doing. Specification limits come from the customer or drawing and show what is acceptable. Limits on subgroup averages are narrower than the spread of individual parts.
When is a process out of control?
When a chart shows a signal, such as a point beyond a control limit or a long run on one side of the center line. Parts may still be in specification, the best time to act.
References: Shewhart (1931), Economic Control of Quality of Manufactured Product; Deming (1986), Out of the Crisis; AIAG SPC Reference Manual; NIST/SEMATECH e-Handbook, X-bar and R charts.
Related Reading
Control charts are only as useful as the data feeding them. See how manufacturing process monitoring software plots live SPC charts with quality alerts, and how manufacturing traceability software ties every measured value to the part it came from. For more detail, read Cp and Cpk Explained: Capability Once the Process Is Stable, and CNC Tool Life Monitoring and SPC Charts.
Get Started Today! Book a call with sfHawk | Email: inquiry@sfhawk.com | Phone: +91 91120 98351 | Website: www.sfhawk.com