TEEP and OEE use different time bases. See both calculated for the same plant, with formulas, a 24 hour timeline and guidance on when to use each.
TL;DR: TEEP (Total Effective Equipment Performance) measures how much of all calendar time your equipment spends making good parts at full speed. OEE measures the same thing against only the time you scheduled production. TEEP equals OEE multiplied by utilization, so it exposes capacity you never planned to use.
Key Takeaways
- Different time bases: OEE is measured against scheduled production time. TEEP is measured against every hour in the calendar.
- One formula links them: TEEP = OEE × utilization, where utilization is scheduled time divided by calendar time.
- Good OEE can hide idle capacity: A plant can post a 69% OEE and a TEEP below 50%, which means a large share of capacity was never scheduled.
- Use each for its own job: Use OEE to remove losses inside the schedule. Use TEEP to decide whether you need more capacity at all.
OEE vs TEEP at a Glance
| Aspect | OEE | TEEP |
|---|---|---|
| Time base | Planned production time | All calendar time, 24 hours a day |
| Formula | Availability × Performance × Quality | OEE × Utilization |
| Question it answers | How well did we run when we planned to run? | How much of our total capacity became good parts? |
| Typical use | Daily loss reduction, shift comparison | Capacity planning, capital decisions |
| Blind spot | Ignores hours that were never scheduled | Counts hours that may be unscheduled by choice |
OEE is the standard for day to day improvement, and OEE monitoring breaks it into availability, performance and quality for each machine. TEEP adds one more factor so the same losses can be seen against the full calendar.
Worked Example: One Plant, Both Metrics
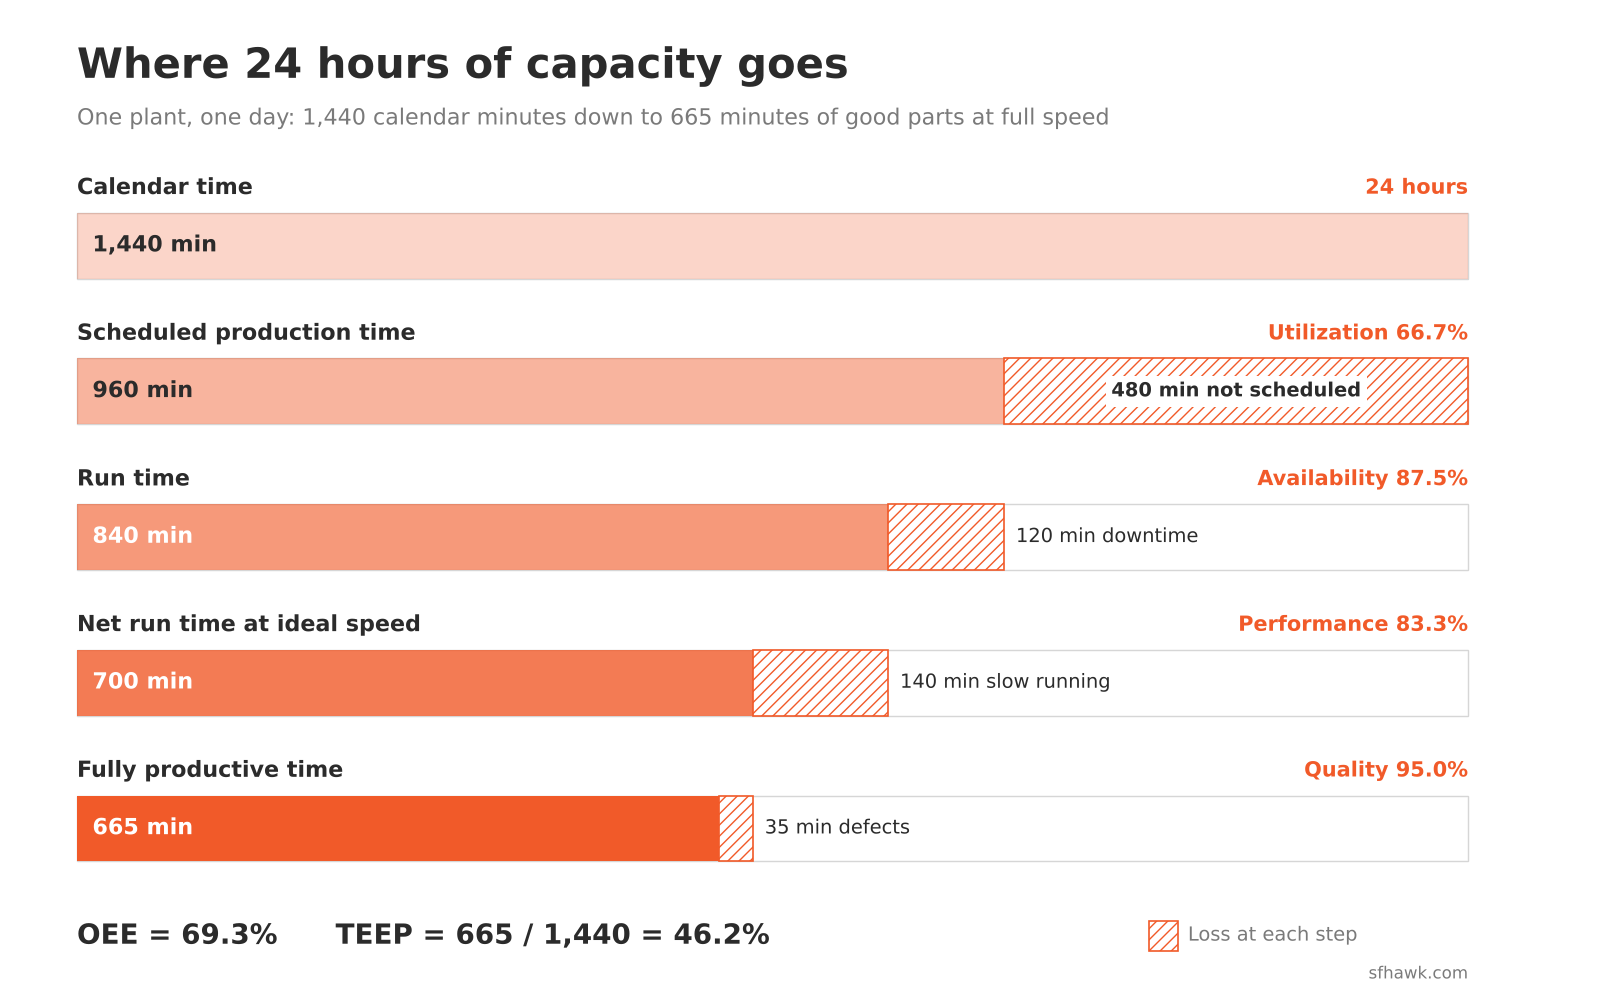
A plant runs two 8-hour shifts in a 24-hour day. The ideal cycle time is 1 minute per part. The plant makes 700 parts, 665 of them good, and loses 120 minutes to downtime inside the scheduled shifts.
| Step | Calculation | Result |
|---|---|---|
| Calendar time | 24 hours × 60 | 1,440 min |
| Scheduled production time | 2 shifts × 8 hours | 960 min |
| Run time | 960 minus 120 downtime | 840 min |
| Availability | 840 / 960 | 87.5% |
| Performance | (700 parts × 1 min) / 840 | 83.3% |
| Quality | 665 / 700 | 95.0% |
| OEE | 87.5% × 83.3% × 95.0% | 69.3% |
| Utilization | 960 / 1,440 | 66.7% |
| TEEP | 69.3% × 66.7% | 46.2% |
Cross-check: 665 fully productive minutes / 1,440 calendar minutes = 46.2%
An OEE of 69% looks respectable. TEEP shows that only 46 of every 100 calendar minutes ended as good parts. Of the 775 minutes that did not, 480 sat outside the schedule and 295 were lost inside it to downtime, slow running and defects. Those are two different problems with two different owners.
“High OEE only tells you the plant is good at using the hours it chose to run. It says nothing about the hours it chose not to.”
[Name], [Designation], [Company]
When to Use OEE and When to Use TEEP
- Use OEE for losses inside the schedule: Find and rank downtime, slow cycles and defects during planned production.
- Use TEEP before adding capacity: Check it before approving a new machine or an extra shift, because it shows how much calendar time the current equipment leaves unused.
- Use TEEP for costly or constrained assets: Furnaces, presses or a bottleneck machine, where idle hours cost real money.
- Report both: State the time base on every report. Each metric answers a different question.
Measuring Hidden Capacity with Real Run Time
TEEP needs honest run, stop and idle time for every hour of the day, and that is hard to collect by hand, especially on nights and weekends. sfHawk records machine status automatically through machine monitoring software, so run time and stop time are measured for each machine and can be compared with the planned production time.
That lets a plant separate two things that look alike in a monthly report. Unused calendar hours are a scheduling decision. Hours lost inside the schedule are an operational problem. Machines that look busy on paper sometimes turn out to have long idle stretches between shifts or at weekends, and that is often the cheapest capacity a plant can recover. Production monitoring software puts output against those hours by shift, so the gap stays visible.
Losses inside the schedule often trace back to unplanned breakdowns. Condition monitoring and preventive maintenance software flags degrading equipment early, which protects availability on the assets where TEEP matters most.
Frequently Asked Questions
What does TEEP mean?
TEEP stands for Total Effective Equipment Performance. It is the share of all calendar time that equipment spends producing good parts at ideal speed.
What is the difference between TEEP and utilization?
Utilization is only the share of calendar time that was scheduled, 66.7% in the example. TEEP multiplies utilization by OEE, so it also reflects downtime, speed loss and defects. Some plants define utilization as run time over calendar time, so write down which definition you use.
When should plants use TEEP?
Use it when the question is about capacity: whether to add a machine, a shift or a line, or how much headroom an asset has. For daily improvement work inside scheduled hours, OEE is the better tool.
What is the difference between OEE and OOE?
OOE, overall operations effectiveness, is OEE calculated over all the time a plant is operating, including planned stops such as breaks. It usually reads lower than OEE and higher than TEEP. Definitions vary, so confirm the time base before comparing numbers.
Related Reading
Capacity decisions are only as good as the run time behind them. See how OEE monitoring breaks losses into availability, performance and quality, and how machine monitoring software captures run, stop and idle time by machine. To track output against planned hours by shift, explore production monitoring software. For the wider picture, read about smart factory and Industry 4.0 monitoring and the 10 manufacturing KPIs every plant manager should track.
Get Started Today! Book a call with sfHawk | Email: inquiry@sfhawk.com | Phone: +91 91120 98351 | Website: www.sfhawk.com